


Spatial interpolation (kriging), explained for epidemiologists
You have measurements at a handful of places and need an estimate everywhere else. Kriging gives you that estimate, and it also tells you how far to trust it.
Nearby things are more alike
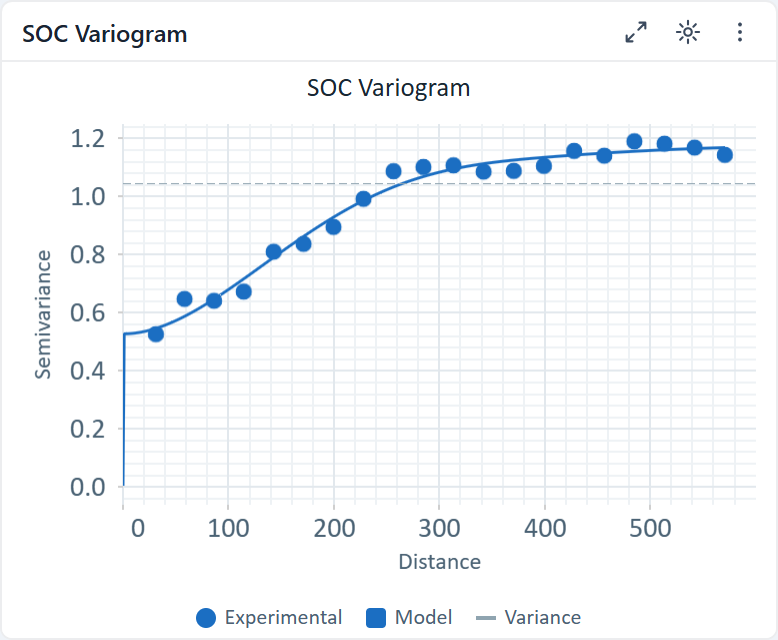
Kriging starts from a simple observation: samples close together tend to have similar values. The variogram measures how that similarity decays with distance. Its three parameters have plain meanings. The nugget is variation you see even at zero distance, from measurement error or very local effects. The sill is the total variance. The range is the distance beyond which samples stop telling you anything about each other.
 Fitted variogram of soil organic carbon · one Ontario field
From weights to a surface
For each location without a sample, kriging finds the weighted average of nearby samples that is unbiased and has the smallest expected error, given the variogram. Closer and less redundant samples get more weight. Repeat that across a grid and you have a continuous surface.
Report the uncertainty too
Every kriged estimate comes with a kriging variance. Map it next to the estimate: areas far from samples will show high variance, and that is where to be careful with conclusions, or where to sample next.