One workspace for every spatial question.
Import data, run geostatistics, regression and cluster analysis, and explore the results in linked maps and charts that animate through time. The AI Advisor sits beside you the whole way.
The product tour: one Vesta Online project, from a plain-English question to a shared analysis, in about two minutes.
 AI Analysis Advisor
Describe the question. The Advisor handles the setup.
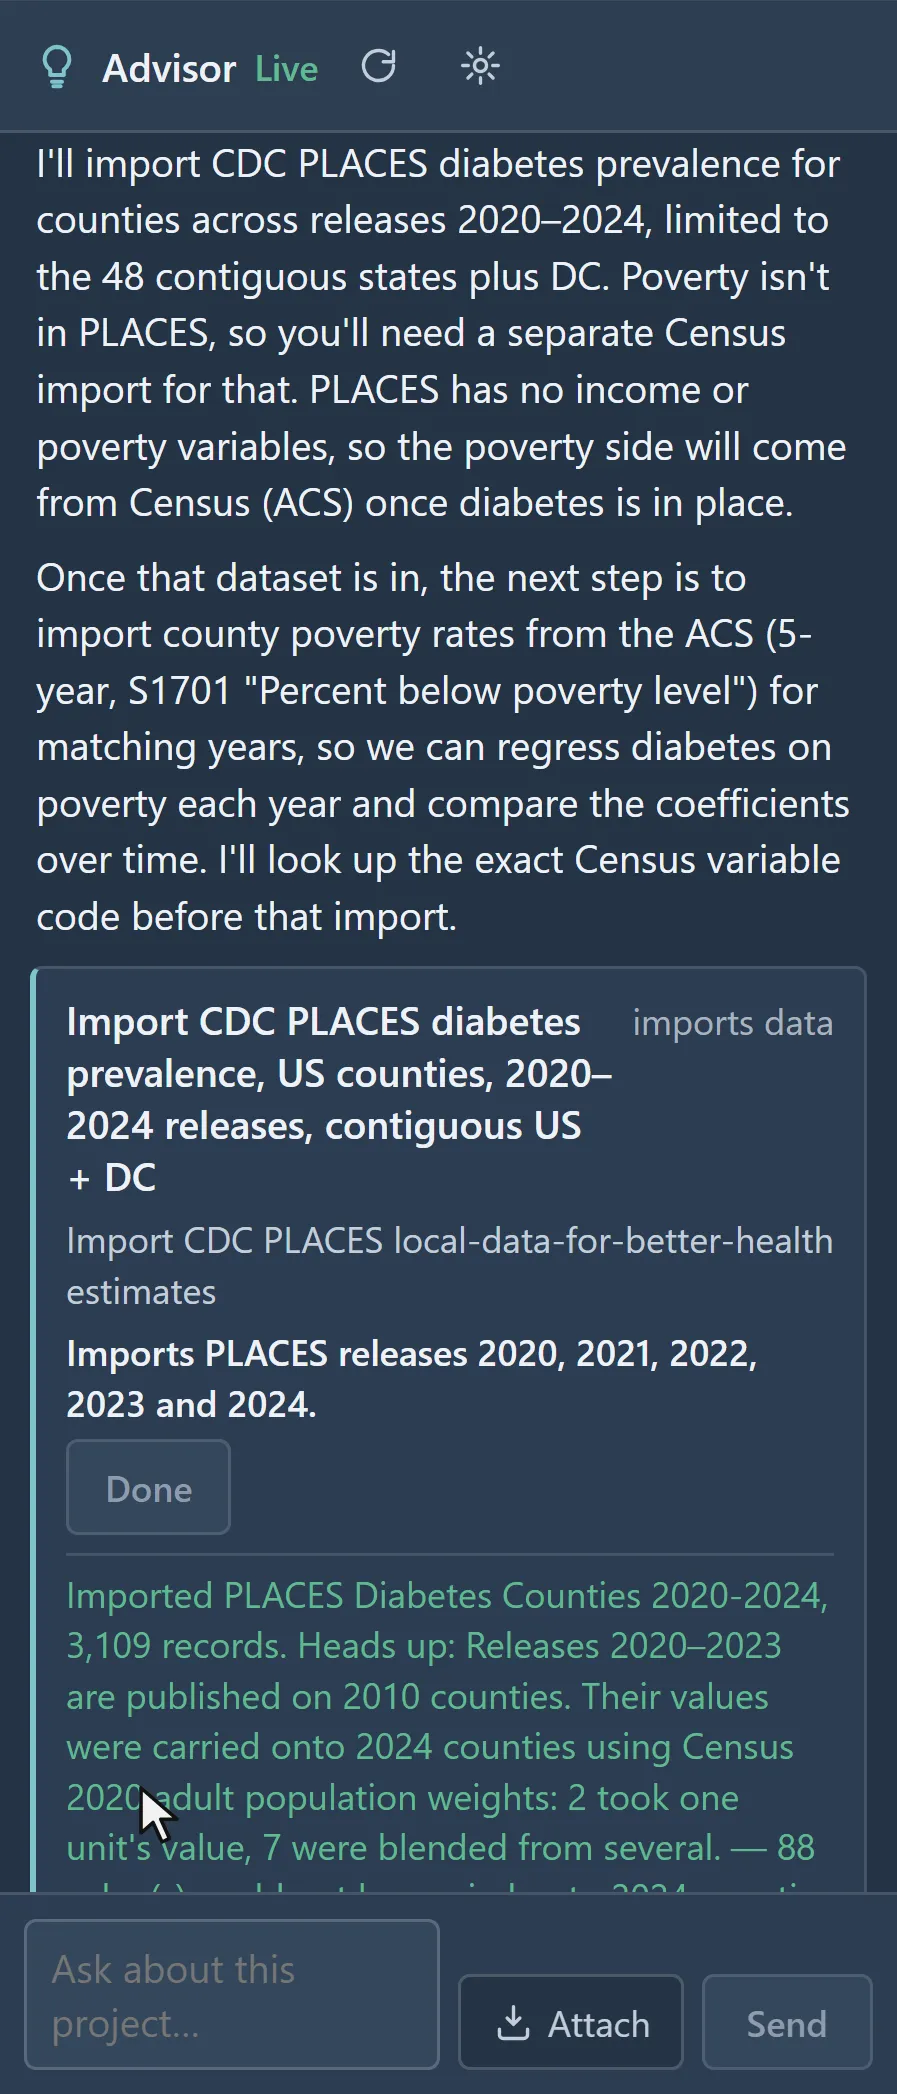
Ask in plain language, in any language. The Advisor finds datasets that match your question, imports them, recommends a method suited to your data and goal, and runs it, explaining each step and its caveats as it goes.
 The Advisor proposes the CDC PLACES diabetes import · U.S. counties, 2020–2024
 Spatial Interpolation
From scattered samples to a continuous surface.
Fit a variogram automatically, krige, and cross-validate in a few steps. Vesta selects the right forward and back-transforms for logratios and indicators and applies them for you.
Kriged soil organic carbon · one Ontario field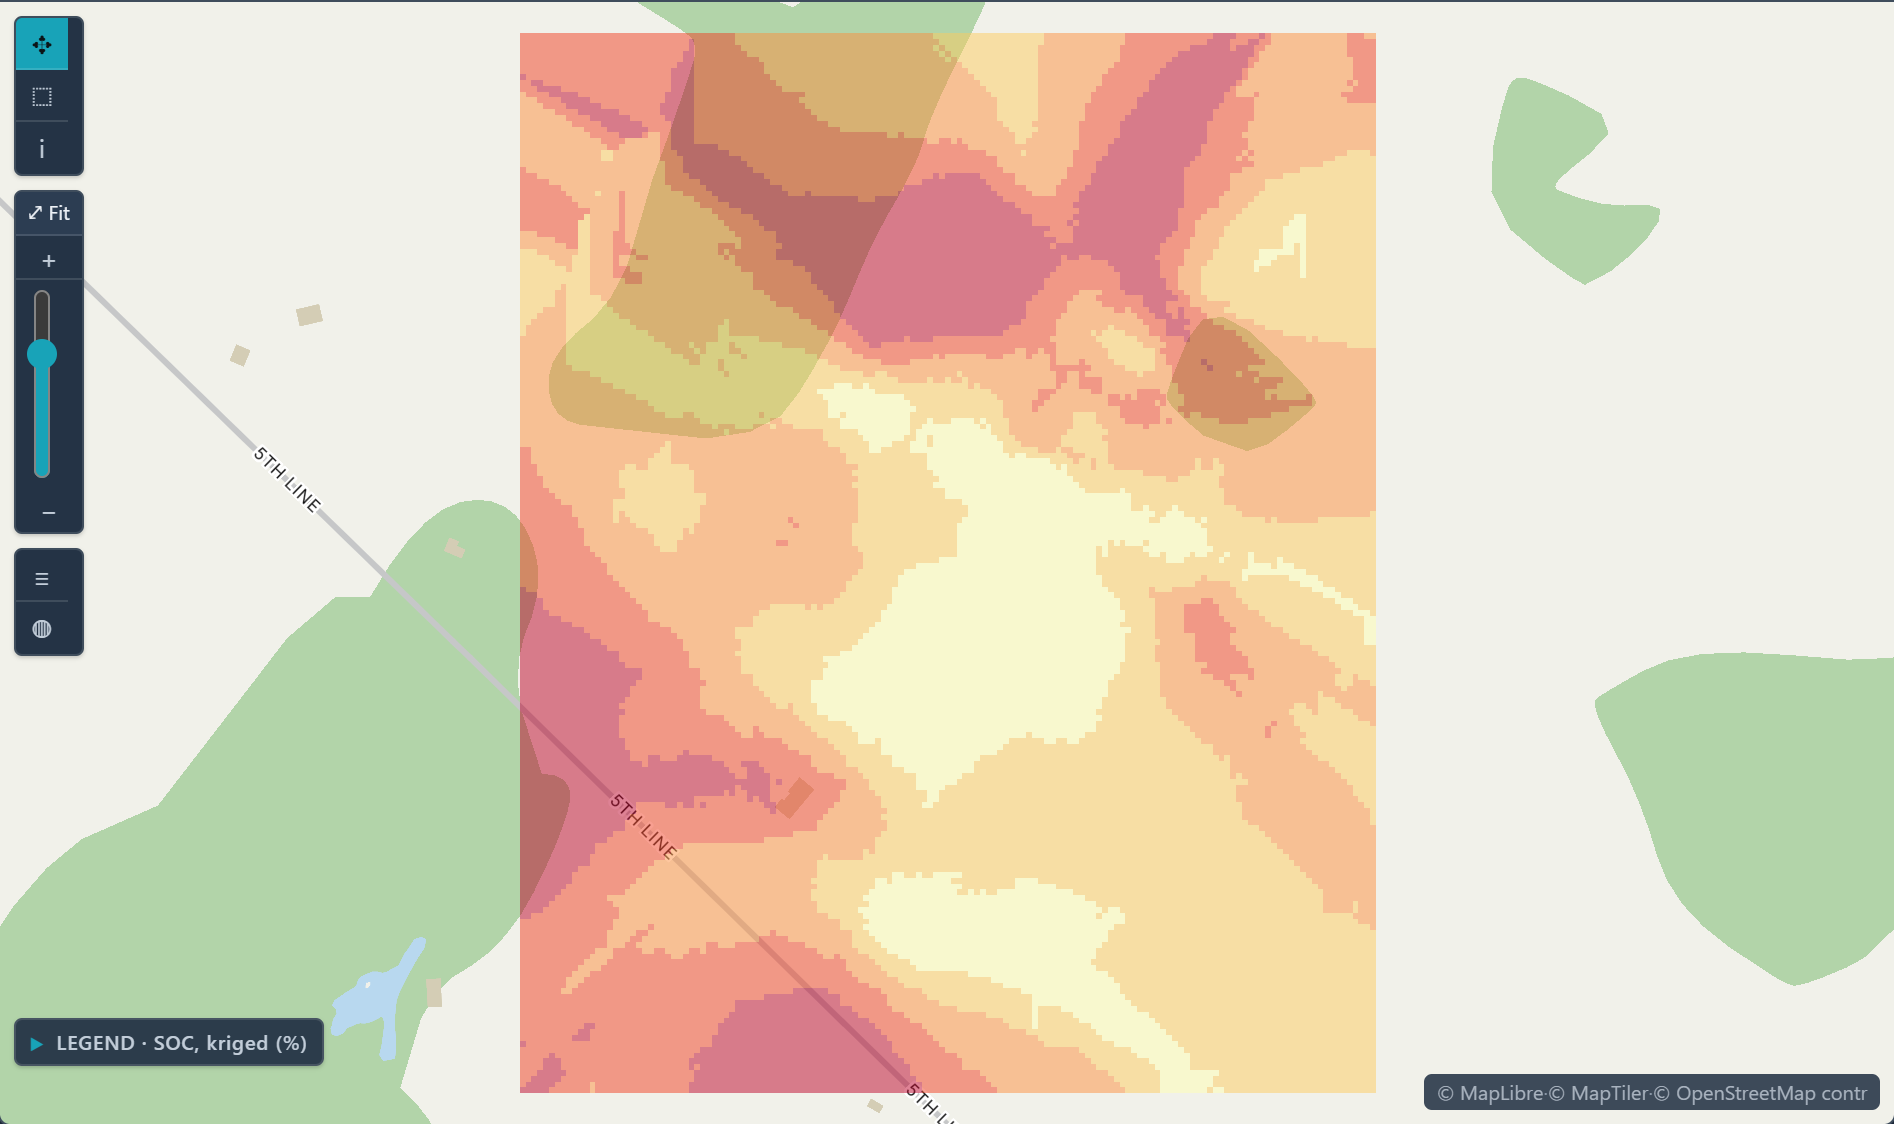
 Regression & Machine Learning
Explain the pattern, not just the map.
Classical regression, geographically weighted regression that lets relationships vary by place, joinpoint models for trend changes, and gradient-boosted machine learning when prediction matters more than coefficients.
Local GWR slope · diabetes per point of poverty, U.S. counties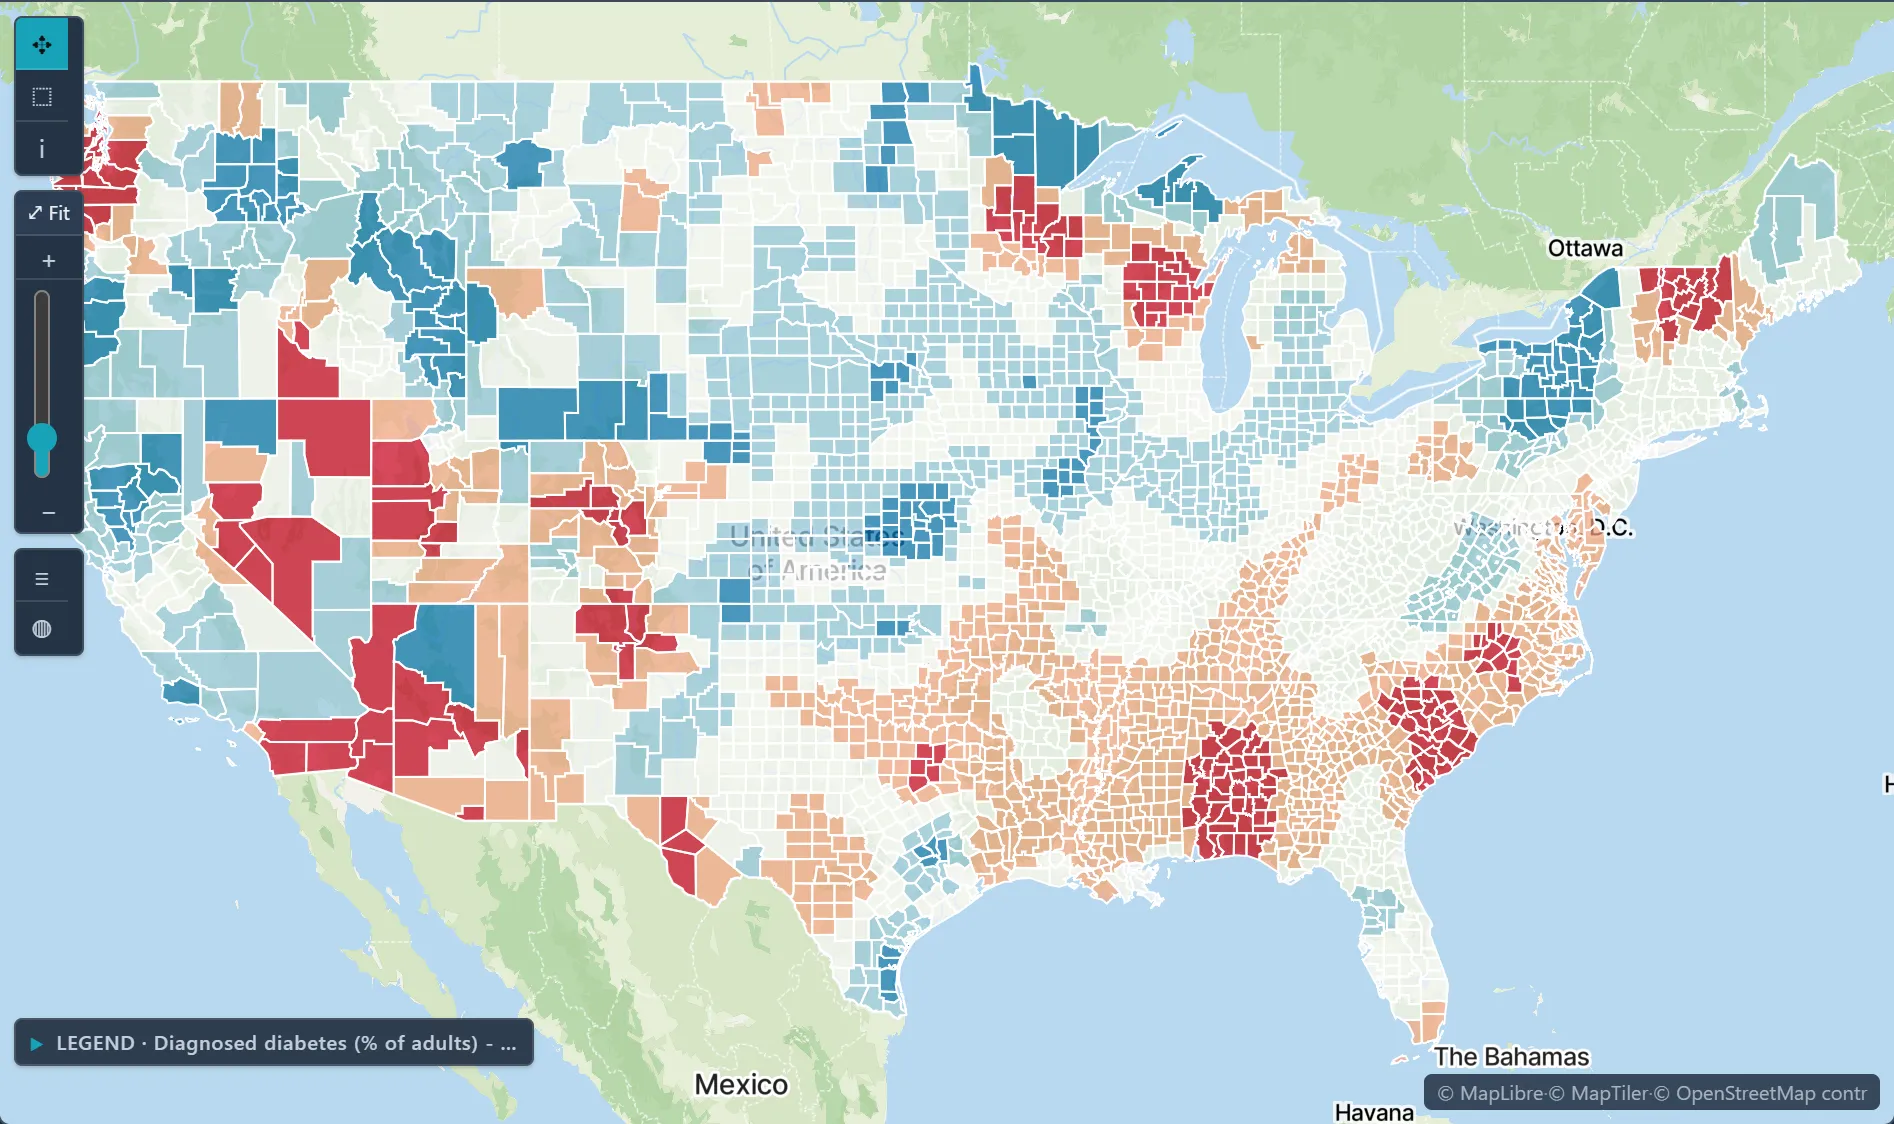
 Cluster & Hotspot Detection
Is it a cluster, or just noise?
Local Moran's I, spatial and space-time scan statistics, Q-statistics for case-control data, and space-time interaction tests identify significant hot spots, cold spots and outliers, with Monte Carlo significance testing and maps ready to share.
Local Moran's I clusters · diabetes among U.S. adults, by county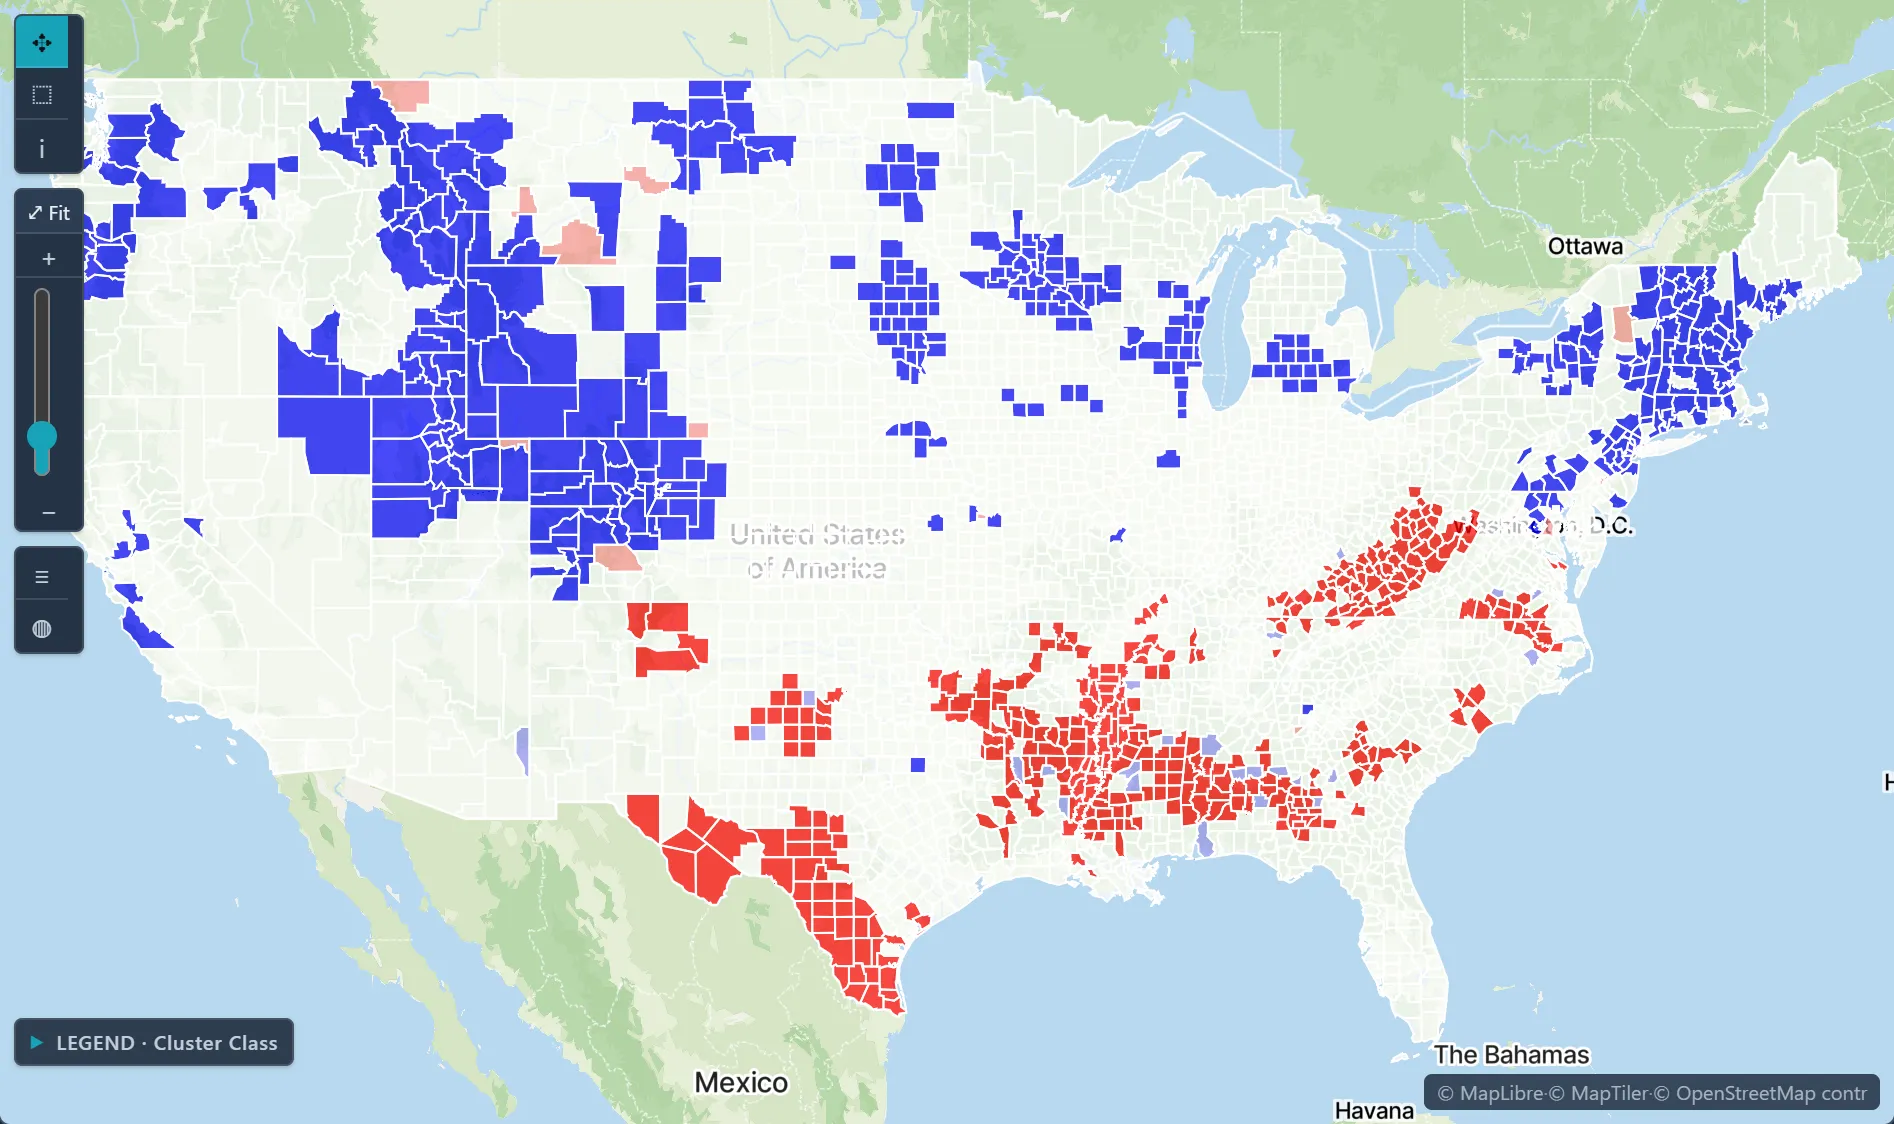
 Space-Time Visualization
See change as it happens.
Animate any variable across time, and select anything, anywhere: a selection on the map highlights the same places in every chart and table. Grid, Focus and Compare layouts keep several views in front of you.
Overdose death rate per 100,000 by county · Ohio, 2021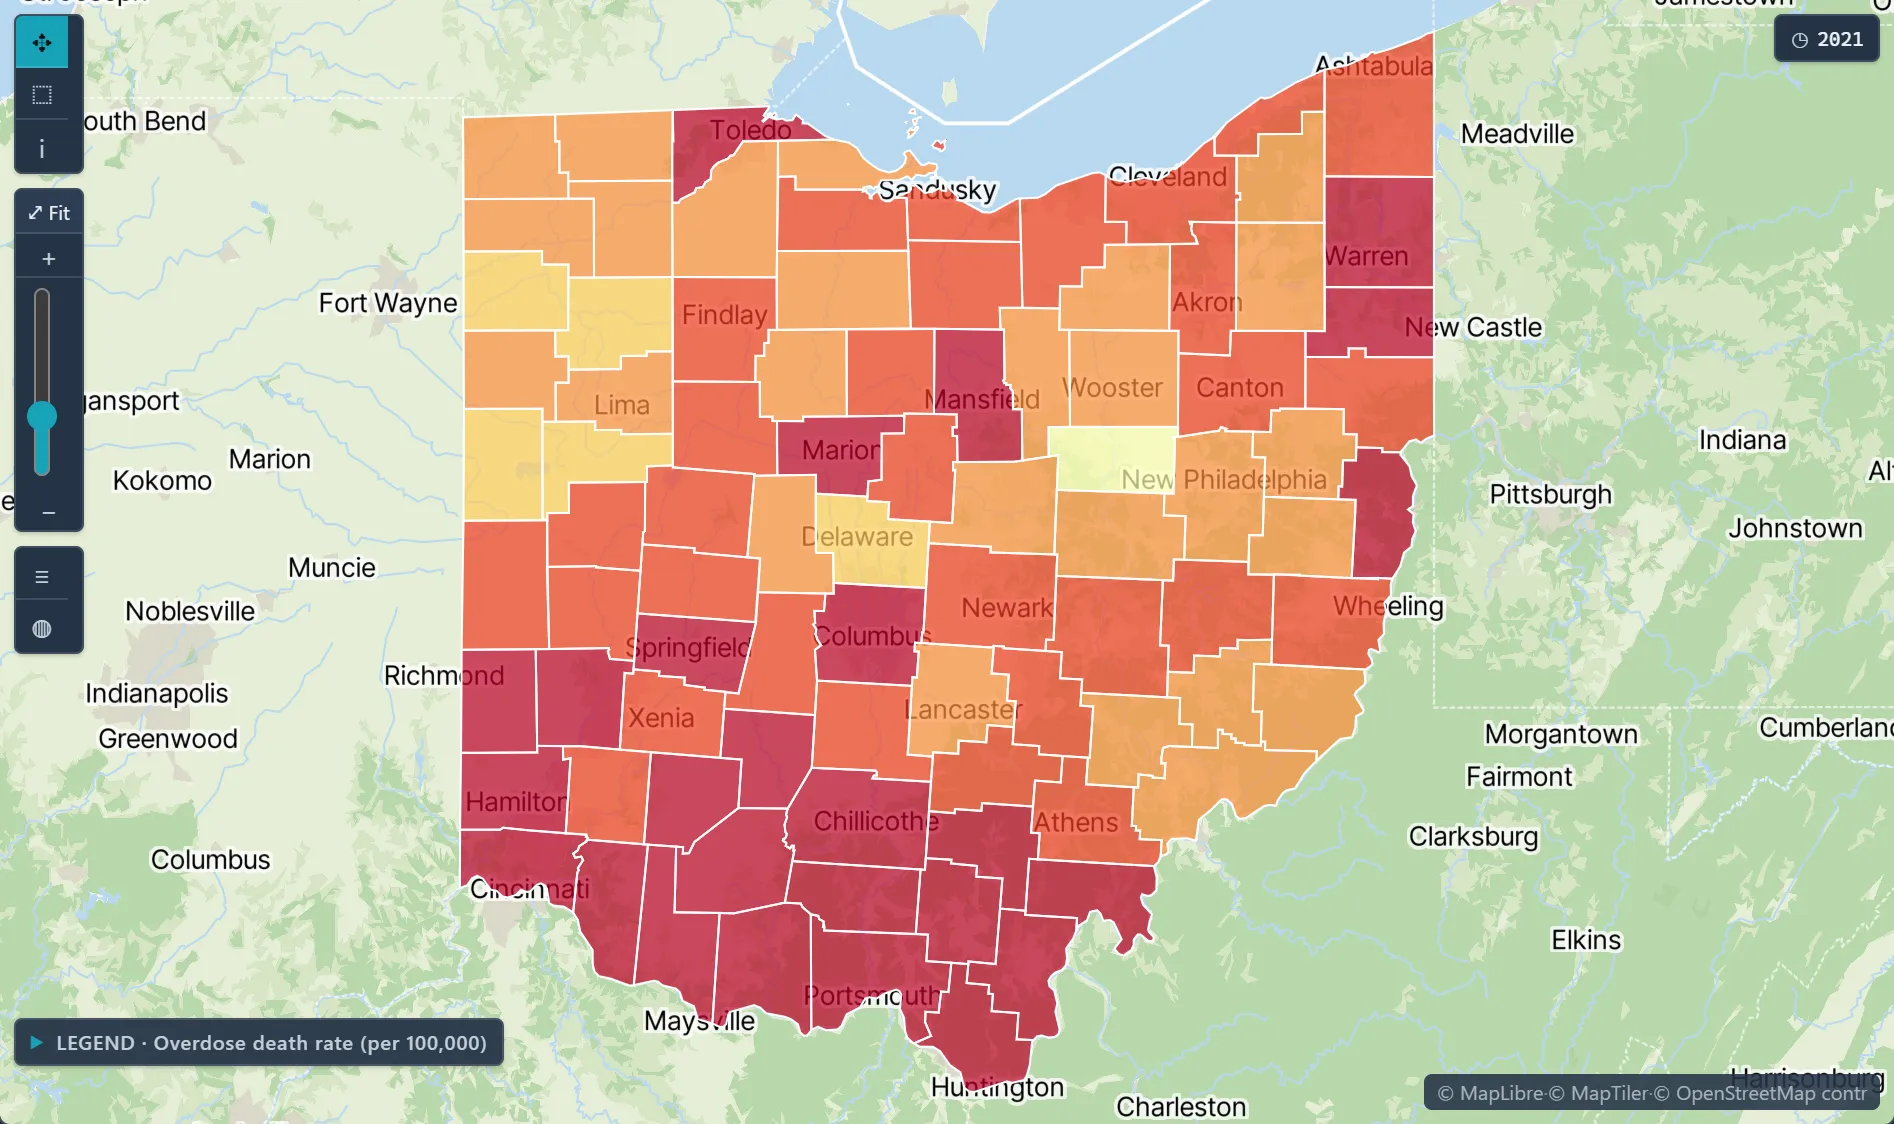
 Data Library
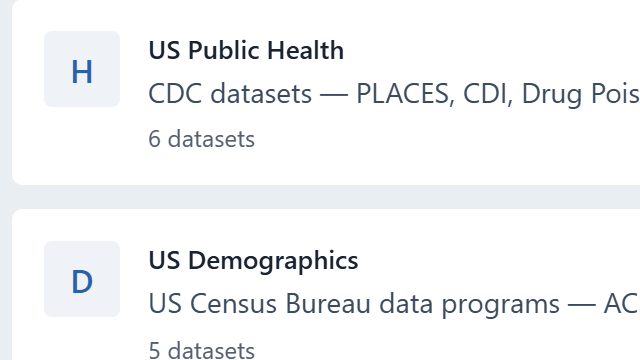
25+ public data sources, a click away.
Pick a source, choose the measures, the places and the years. Vesta fetches the data and joins it to boundaries, ready to map, with no downloading, cleaning or merging.
Add Data · Data Library categories: US Public Health, US Demographics