


Teaching & students
Teach spatial statistics, not software syntax.
Students run cluster analysis and geographically weighted regression on real county data in a browser, with nothing to install, so class time goes to interpreting the results.
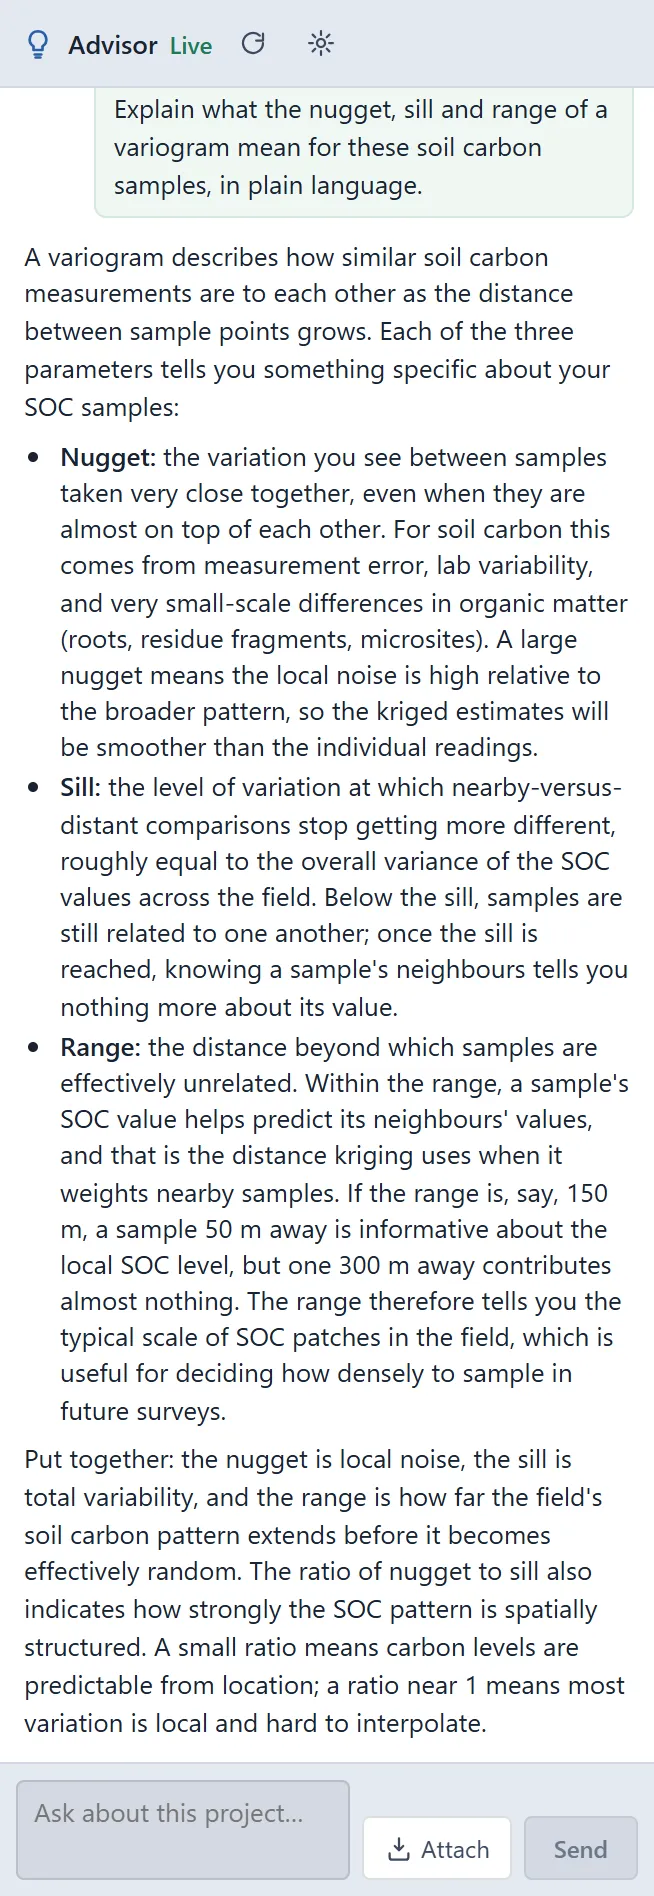
 The Advisor explains nugget, sill and range · soil organic carbon
The challenge
Lab time disappears into installs and code errors.
Step 1Nothing to installStudents open Vesta Online in a browser on any computer and sign in. A sample opens read-only, so each student makes a copy and works on that.How to: Quickstart
Step 2Real data from day oneThe Data Library holds CDC PLACES, ACS and other public sources, and SSA Baby Names is a light first exercise.How to: Data Library
Step 3Run a cluster analysisLocal Cluster Analysis flags High-High and Low-Low counties; setting a seed lets a class repeat the same run.How to: Local cluster analysis
Step 4Learn by askingThe Advisor is an optional AI-assisted guided workflow that helps choose methods and interpret results.How to: Using the Advisor
Worked example · Diabetes and poverty
Class exercise: where does diagnosed diabetes cluster across US counties, and does the link to poverty hold everywhere?
- Start from the counties3,109 counties with diagnosed diabetes (CDC PLACES, 2024 release) and poverty (ACS 2022), on one county layer.How to: Data Library
- Find the local clustersLocal Moran's I with queen contiguity, 999 permutations, a false discovery rate of 0.05 and seed 2026: a global I of 0.625, with 357 High-High counties across the South and 389 Low-Low.How to: Local cluster analysis
- Fit the poverty effectGWR of diabetes on poverty: the local poverty slope runs from about −0.35 to 0.66 points of diabetes per point of poverty.How to: Regression and GWR
What it found
Diabetes clusters across the South: 357 High-High counties, with 389 Low-Low counties. The poverty slope is steepest across much of the Southeast and changes sign in places, so the link is not the same everywhere.
Both variables are estimates, not counts: PLACES is model-based and the ACS is a sample survey. Ask students which numbers are estimates before they read a cluster.
Local GWR slope · diabetes per point of poverty, U.S. counties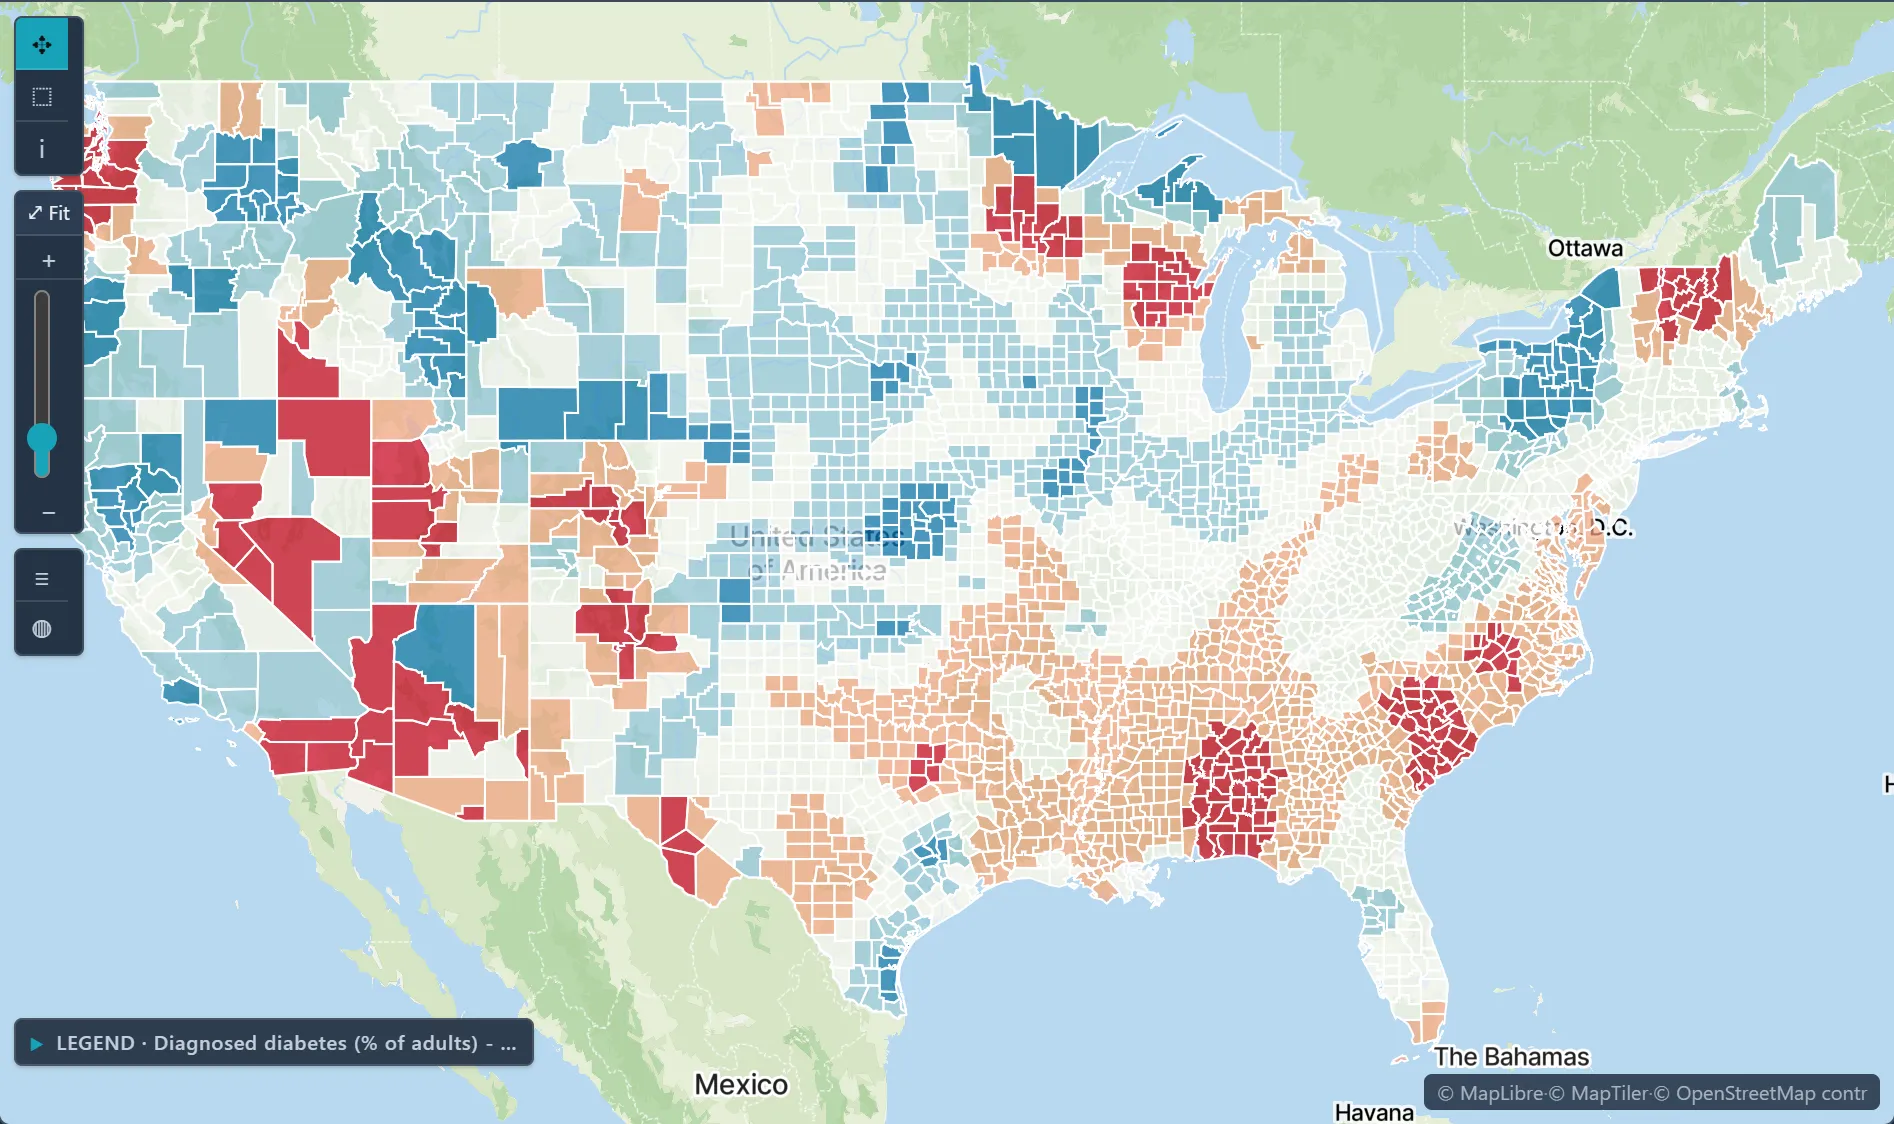
Open the sample projectRead-only · no sign-in
Read in the docs
Methods
Local Cluster AnalysisRegression and GWRJoinpoint regressionKriging
Data
Data LibrarySample projects
Evidence
Published research by BioMedware scientistsFrom natural resources evaluation to spatial epidemiology: 25 years in the makingGoovaerts, P. Mathematical Geosciences 53, 2021.
See every sample project