


Health disparities & access
Show who is left behind, and where.
Link diabetes and other county outcomes to poverty and other measures from the Data Library, then map where the link is strongest and where high rates cluster.
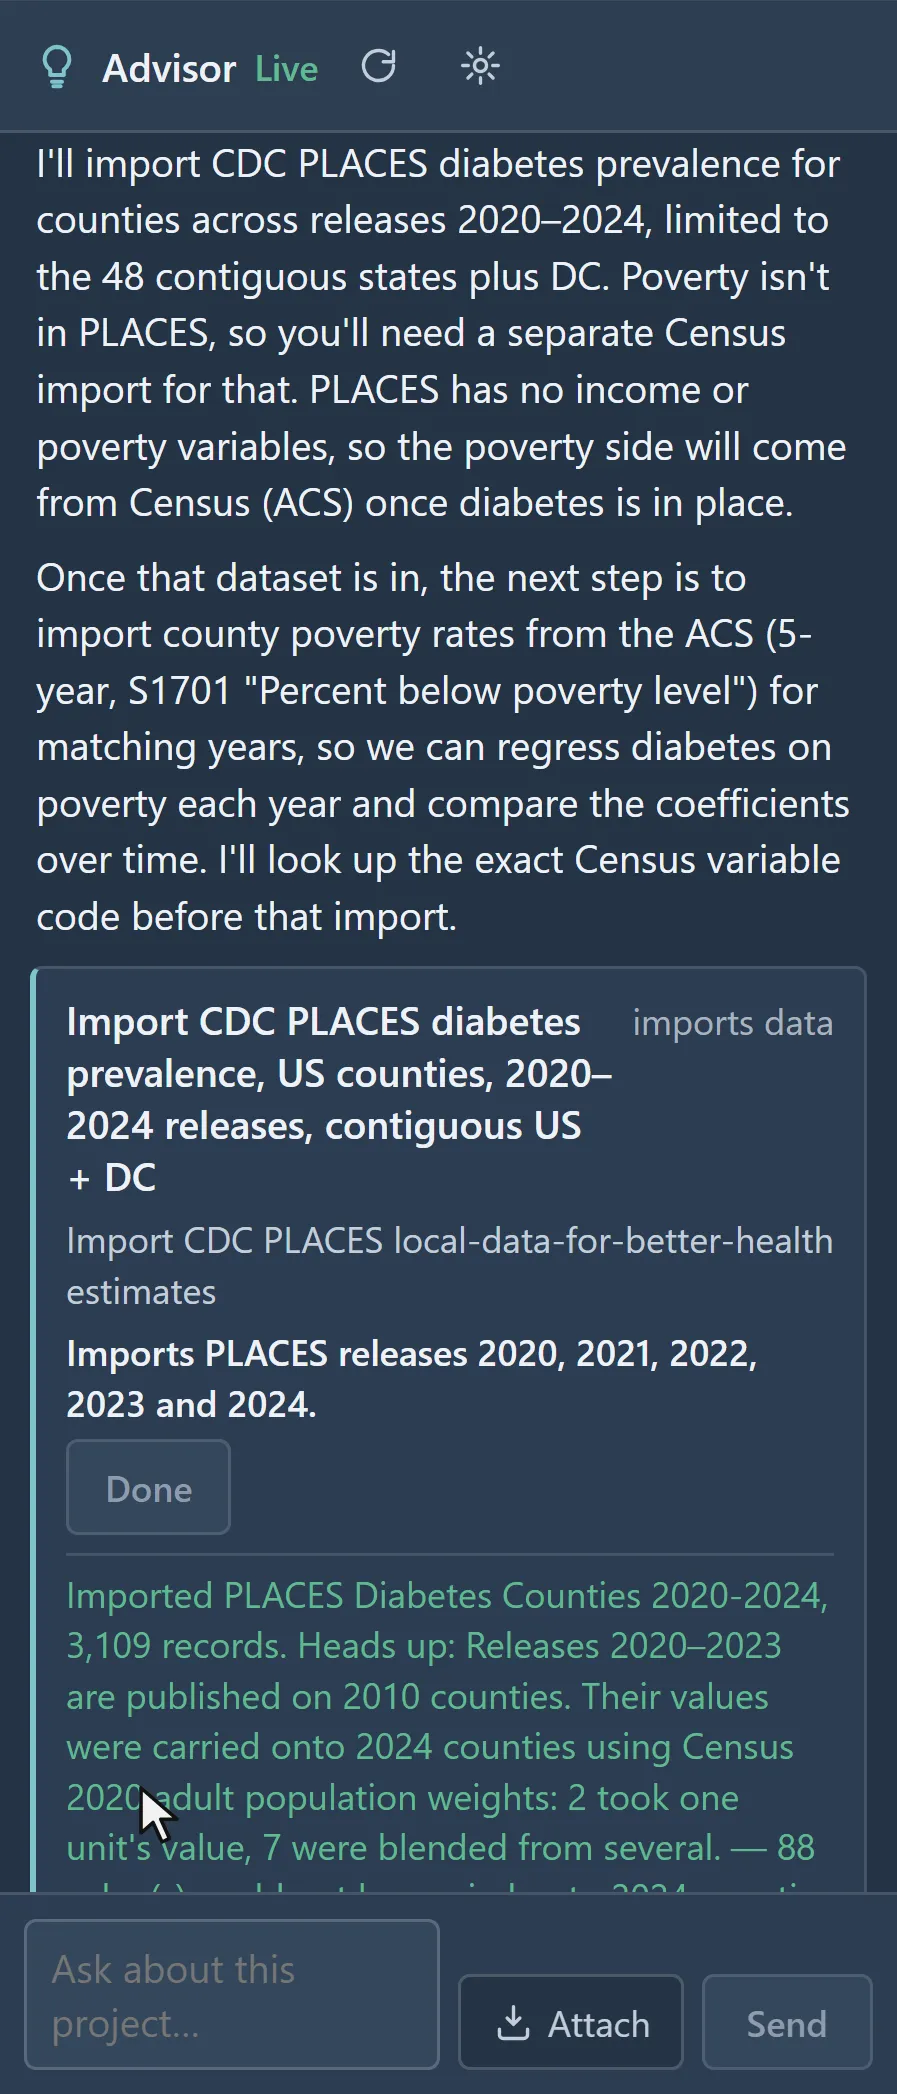
 The Advisor proposes the CDC PLACES diabetes import · U.S. counties, 2020–2024
The challenge
Averages hide the places where disparities are concentrated, and funding decisions need that geography.
Step 1Join the outcome and the factorAdd CDC PLACES diagnosed diabetes and ACS poverty from the Data Library, at county level, onto one county layer.How to: Data Library
Step 2Find where rates clusterLocal Cluster Analysis flags High-High and Low-Low counties; a false discovery rate correction limits the false positives.How to: Local cluster analysis
Step 3Test where the factor matters mostGeographically weighted regression shows how the poverty effect changes across the map, with local R-squared for each county.How to: Regression and GWR
Step 4Make the caseExport the results and a report to attach to grant applications and take to community partners.How to: Exporting data and pictures
Worked example · Diabetes and poverty
Does poverty track diabetes across US counties, and does the link hold everywhere?
- Start from the counties3,109 counties: diagnosed diabetes (CDC PLACES, 2024 release) and poverty (ACS 2022), on one county geography.How to: Data Library
- Find the local clustersLocal Moran's I with queen contiguity, 999 permutations, a false discovery rate of 0.05 and seed 2026: global I is 0.625, with 357 High-High counties across the South and 389 Low-Low.How to: Local cluster analysis
- Fit the poverty effectGWR of diabetes on poverty: R-squared 0.753 globally, local R-squared from 0.06 to 0.96, residual Moran's I 0.009.How to: Regression and GWR
What it found
Diabetes clusters across the South (357 High-High counties), with 389 Low-Low counties. The local poverty slope runs from about −0.35 to 0.66 points of diabetes per point of poverty, steepest across much of the Southeast.
Both variables are estimates, not counts: PLACES is model-based and the ACS is a sample survey.
Local Moran's I clusters · diabetes among U.S. adults, by county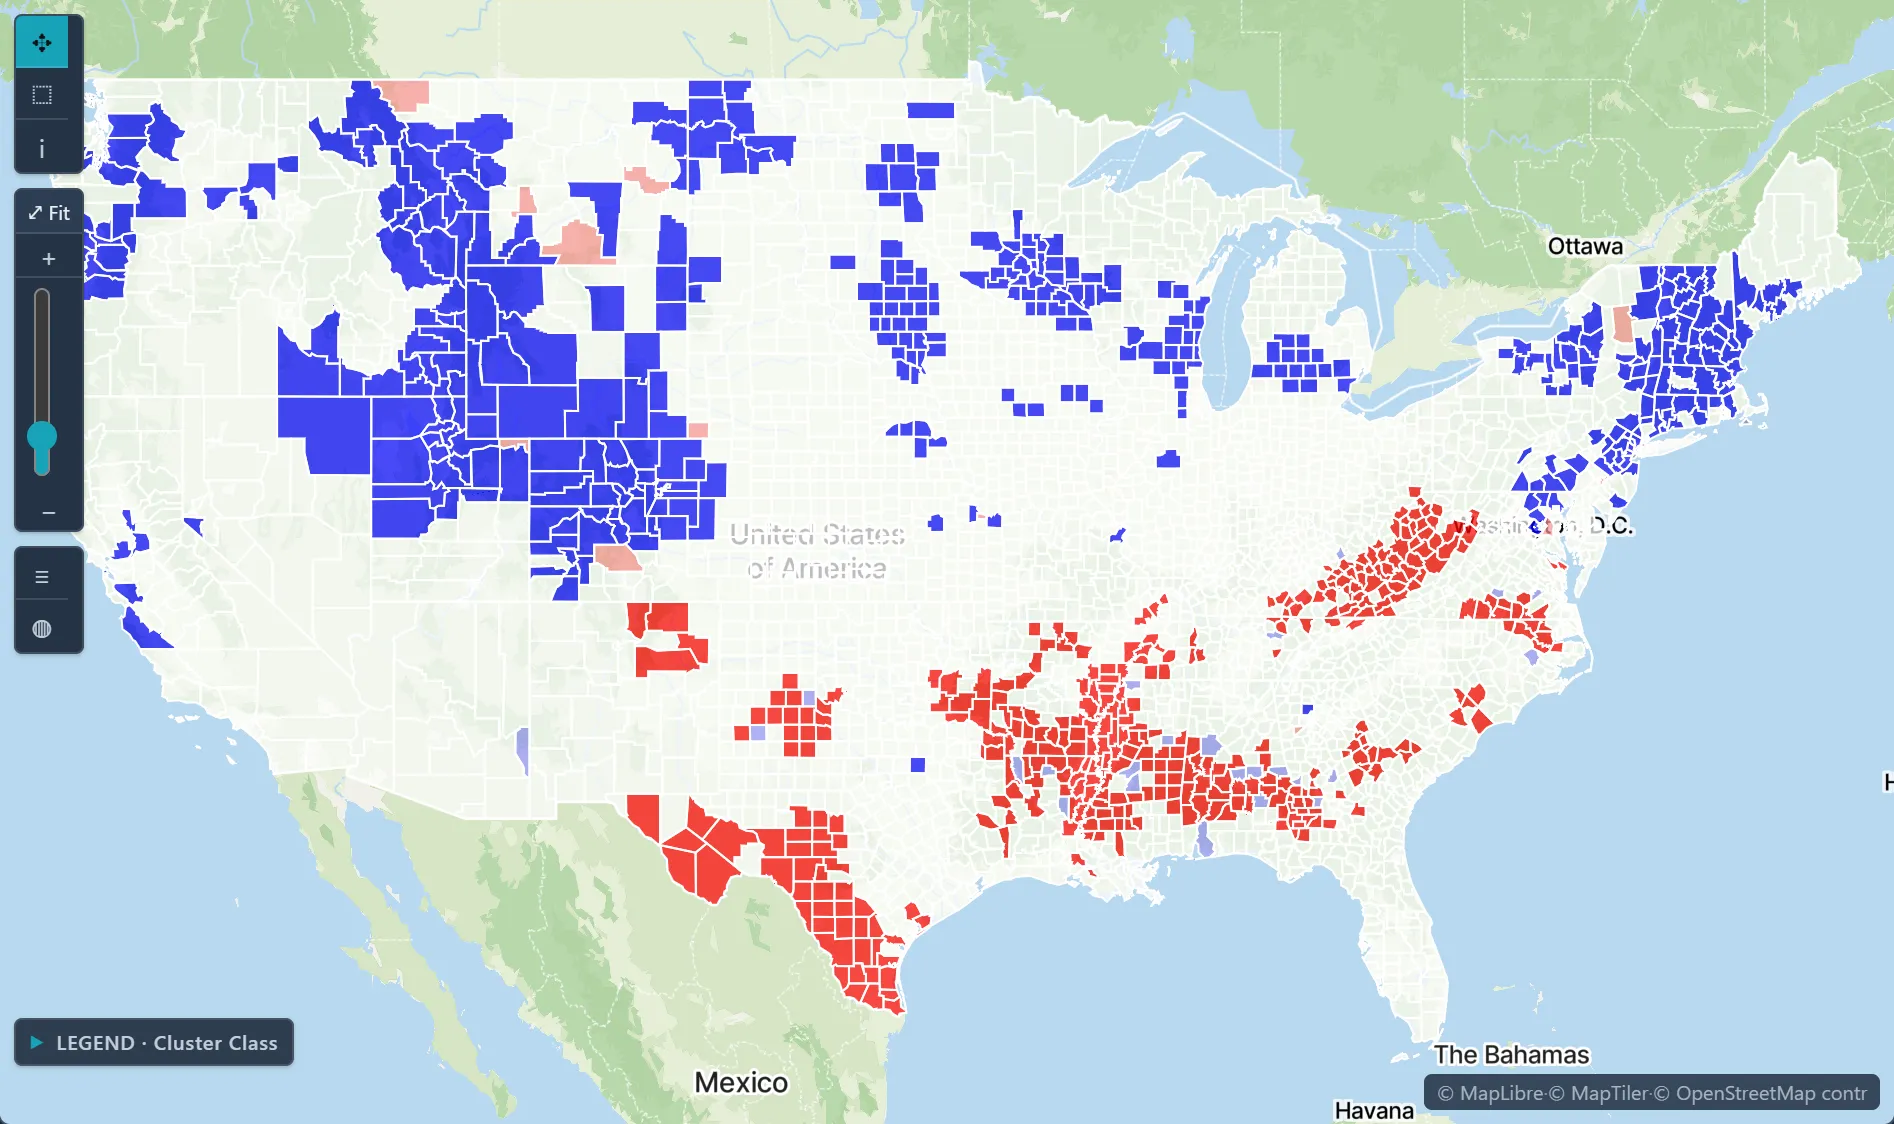
Open the sample projectRead-only · no sign-in
Read in the docs
Methods
GWROLSLocal Moran's ICorrelation matrix
Data
CDC PLACESACS 5-yearCDC CDI
Evidence
Published research by BioMedware scientistsGeographical, temporal and racial disparities in late-stage prostate cancer incidence across Florida: A multiscale joinpoint regression analysisGoovaerts, P., Xiao, H. International Journal of Health Geographics 10, 2011.
See every sample project