


 Regression & Machine Learning
Explain the pattern, not just the map.
Classical regression, geographically weighted regression that lets relationships vary by place, joinpoint models for trend changes, and gradient-boosted machine learning when prediction matters more than coefficients.
 Local GWR slope · diabetes per point of poverty, U.S. counties
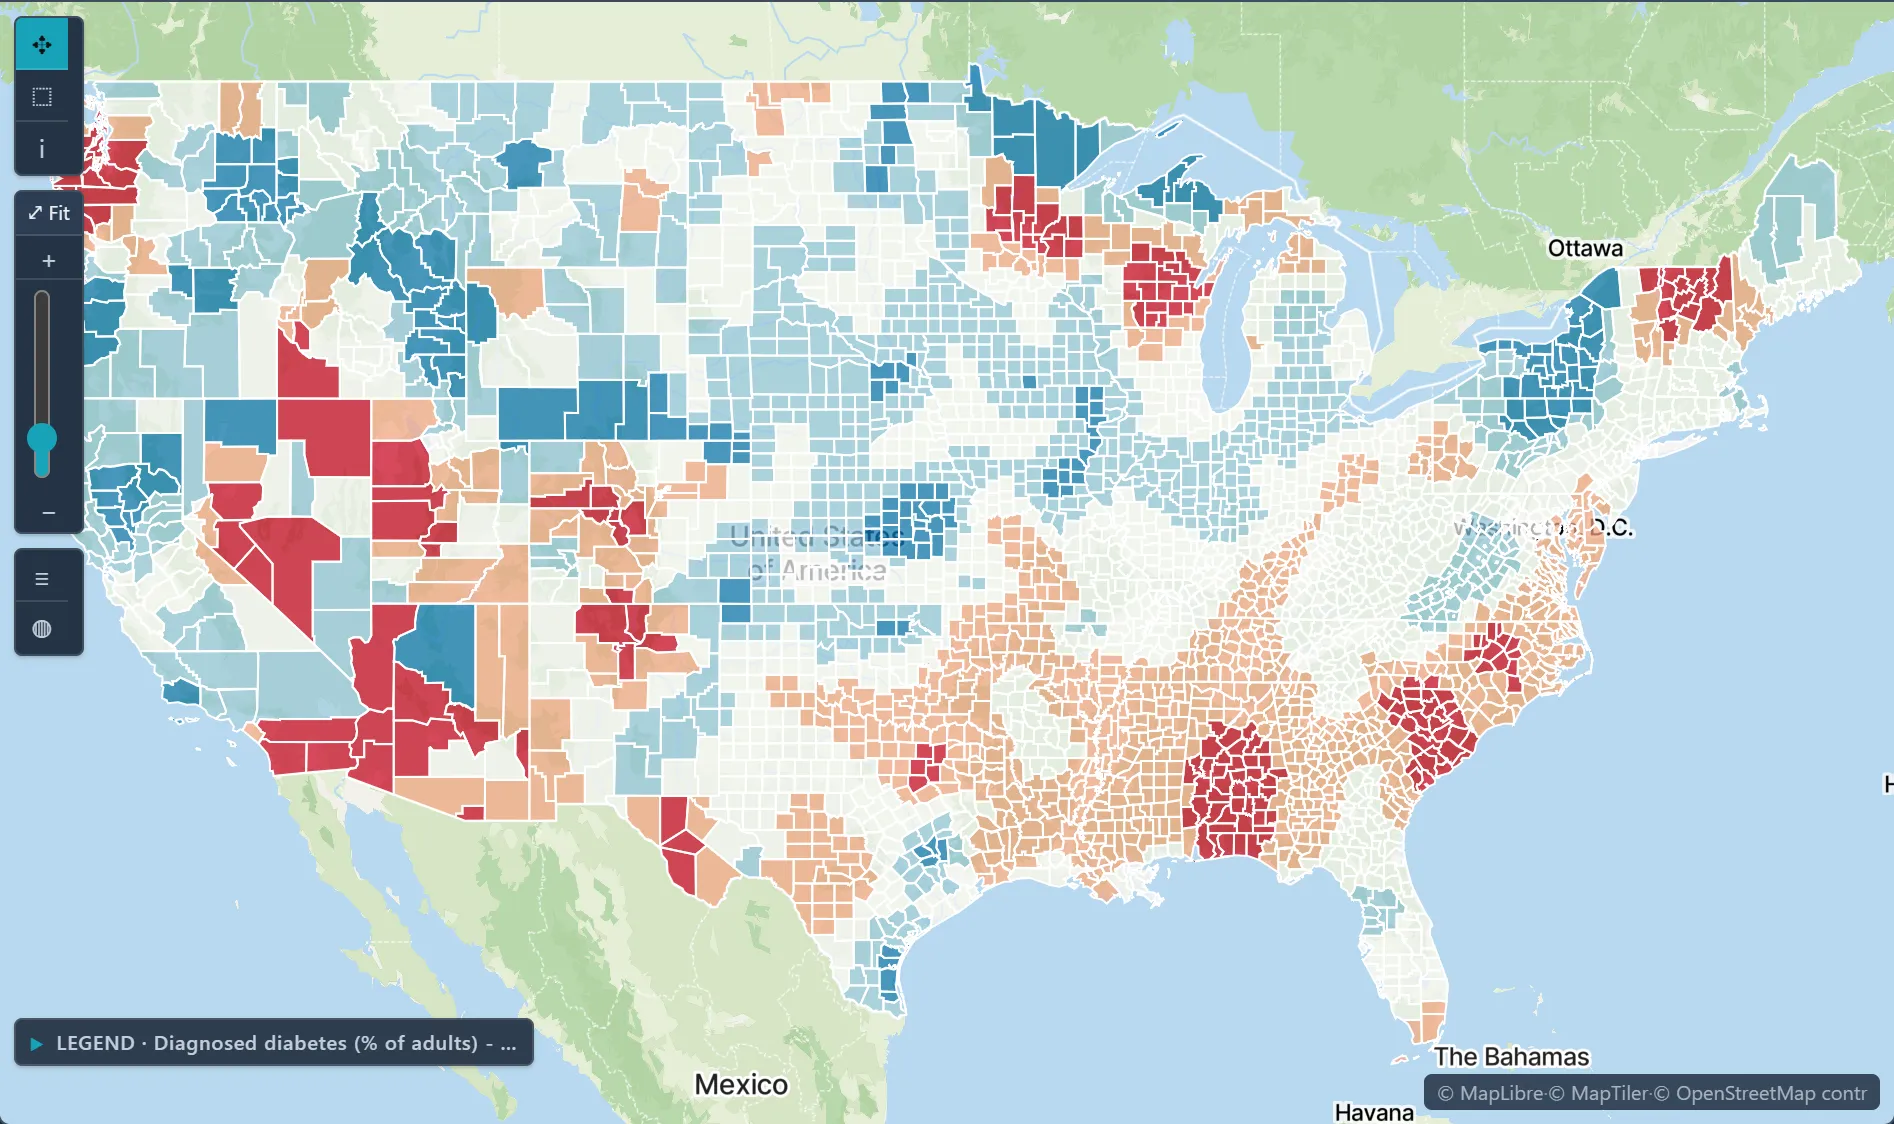
Relationships that vary by placeGWR estimates a local coefficient for every location and maps where a risk factor matters most.
Find when trends changedJoinpoint regression identifies the years a trend turned and reports annual percent change for each segment.
Machine learning includedFastTree and LightGBM regression and classification, with the same maps and charts as every other result.
Pattern explorationMultidimensional scaling to compare places across many variables at once.
County overdose death rates with the statewide joinpoint trend (2014) · Ohio, 2003–2021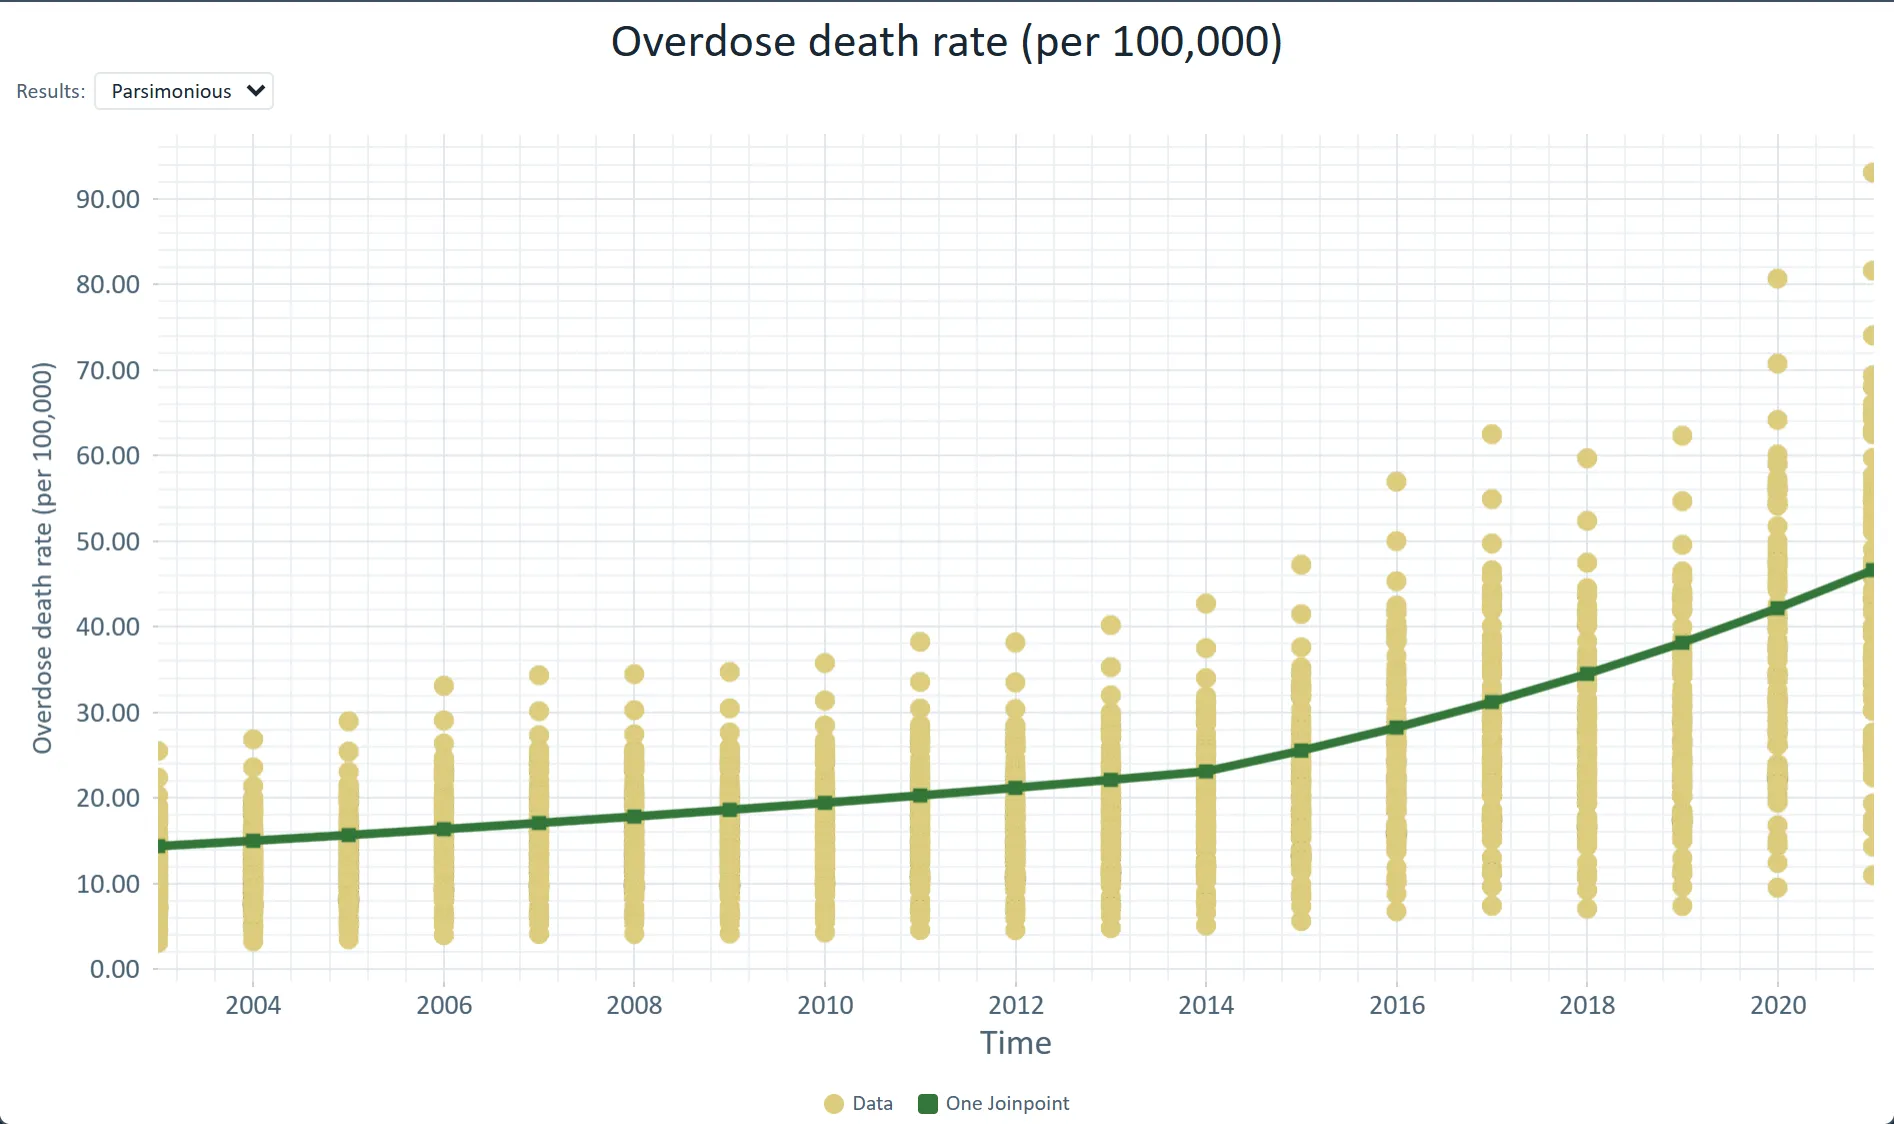
✦ Try asking the Advisor"Which county characteristics best predict childhood asthma ED visits, and where is air quality the strongest factor?"Runs on sample data in the trial workspace.
What's included
OLS regressionLogistic regressionGeographically weighted regressionJoinpoint regressionTrend tests & trend mapsSeasonalityChange-point detectionTrend comparisonCross-correlationTemporal scanFastTreeLightGBM regression & classificationPrincipal component analysisMultidimensional scaling
Risk factor modelingFit a regression of an outcome on its drivers, then check where the model fits well and where it does not. Logistic regression takes a 0/1 outcome, and GWR shows how each effect changes across the map.Health disparities & accessLink diabetes and other county outcomes to poverty and other measures from the Data Library, then map where the link is strongest and where high rates cluster.Disease surveillance over timeCombine joinpoint regression, space-time kriging and the workspace time slider to see where rates rose, when the trend changed, and how the pattern moved.