


Risk factor modeling
Model outcomes against the factors that drive them.
Fit a regression of an outcome on its drivers, then check where the model fits well and where it does not. Logistic regression takes a 0/1 outcome, and GWR shows how each effect changes across the map.
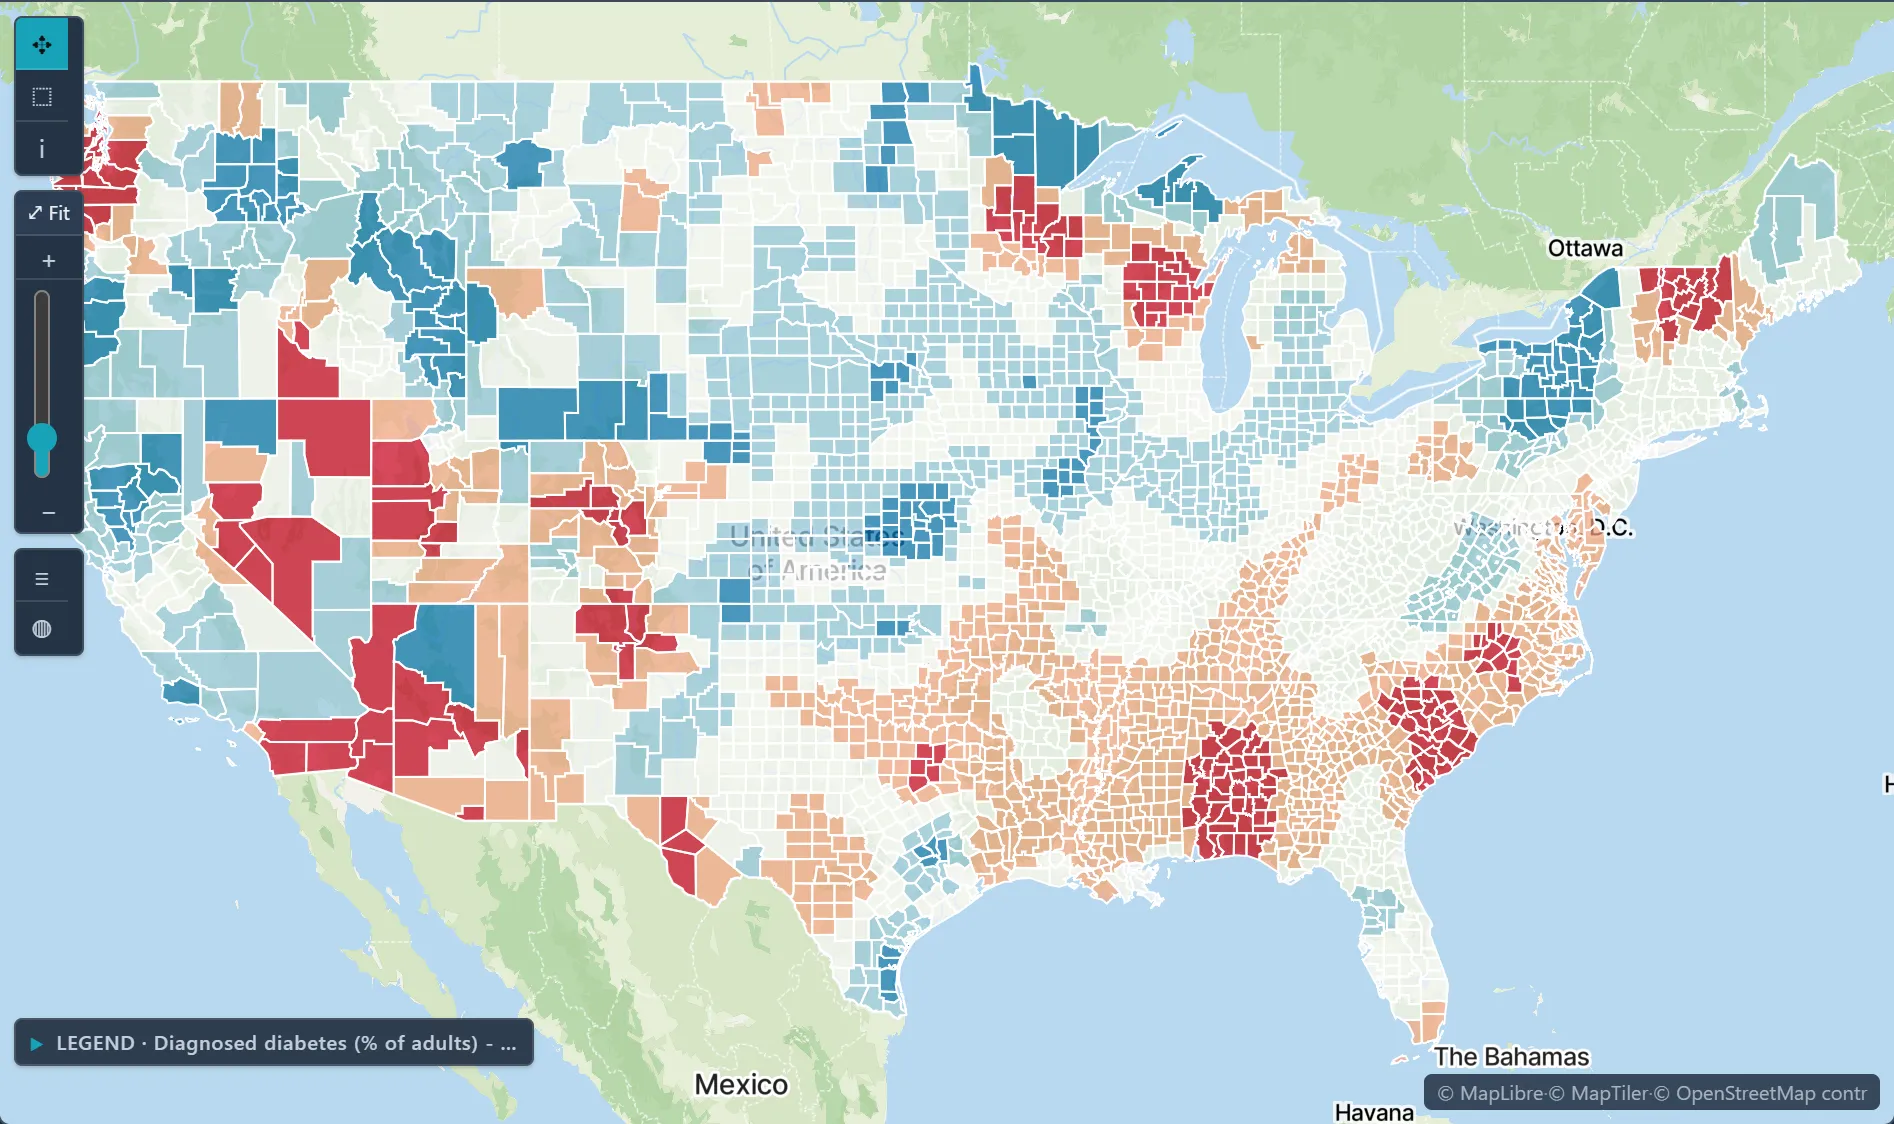
 Local GWR slope · diabetes per point of poverty, U.S. counties
The challenge
You have many candidate predictors, spatially autocorrelated residuals, and reviewers who want both rigor and interpretability.
Step 1Pick the methodOn Analyze, choose the goal Explain a relationship; the Recommended badge marks the methods this project can run.How to: Choosing a method
Step 2Fit the regressionSet the outcome as the dependent variable and the drivers as explanatory variables; a 0/1 outcome selects logistic regression.How to: Regression and GWR
Step 3Check the fit where it mattersRun GWR to see whether each driver's effect changes across the map; check local R-squared and the residual Moran's I.How to: Regression and GWR
Step 4Report the resultsExport the results and a report for the reviewers who will ask how the model was fit.How to: Exporting data and pictures
Worked example · Diabetes and poverty
How strongly does poverty relate to diabetes across US counties, and does that relationship vary by place?
- Start from the countiesDiagnosed diabetes (CDC PLACES, 2024 release) and poverty (ACS 2022) for 3,109 counties on one county layer.How to: Data Library
- Fit GWRGaussian kernel with a bandwidth of 87,410 map units, chosen by AICc over 35 candidates.How to: Regression and GWR
- Check the fitGlobal R-squared 0.753, local R-squared from 0.06 to 0.96, and residual Moran's I is 0.009.How to: Regression and GWR
- Read the slopeThe local poverty slope runs from about −0.35 to 0.66 points of diabetes per point of poverty.How to: Regression and GWR
What it found
Poverty tracks diabetes most strongly across much of the Southeast. The slope changes sign from place to place, so the link is not the same everywhere.
A slope shows association, not cause. Some local slopes are negative, and the local t says whether each one differs from zero, so check it before you read a sign off the map.
Diabetes and poverty · diabetes clusters, U.S. counties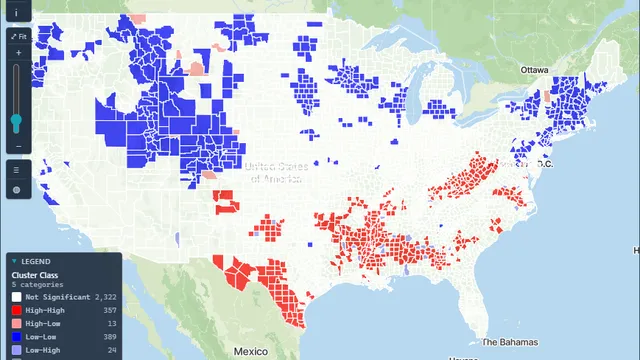
Open the sample projectRead-only · no sign-in
Read in the docs
Methods
OLSLogistic regressionGeographically weighted regressionResidual Moran's ILocal t statistics
Data
Your outcome dataACSCDC EPH TrackingFAOSTAT
Evidence
Published research by BioMedware scientistsLocal bladder cancer clusters in southeastern Michigan accounting for risk factors, covariates and residential mobilityJacquez, G.M., Shi, C., Meliker, J.R. PLOS ONE 10, 2015.
See every sample project