


 AI Analysis Advisor
Describe the question. The Advisor handles the setup.
Ask in plain language, in any language. The Advisor finds datasets that match your question, imports them, recommends a method suited to your data and goal, and runs it, explaining each step and its caveats as it goes.
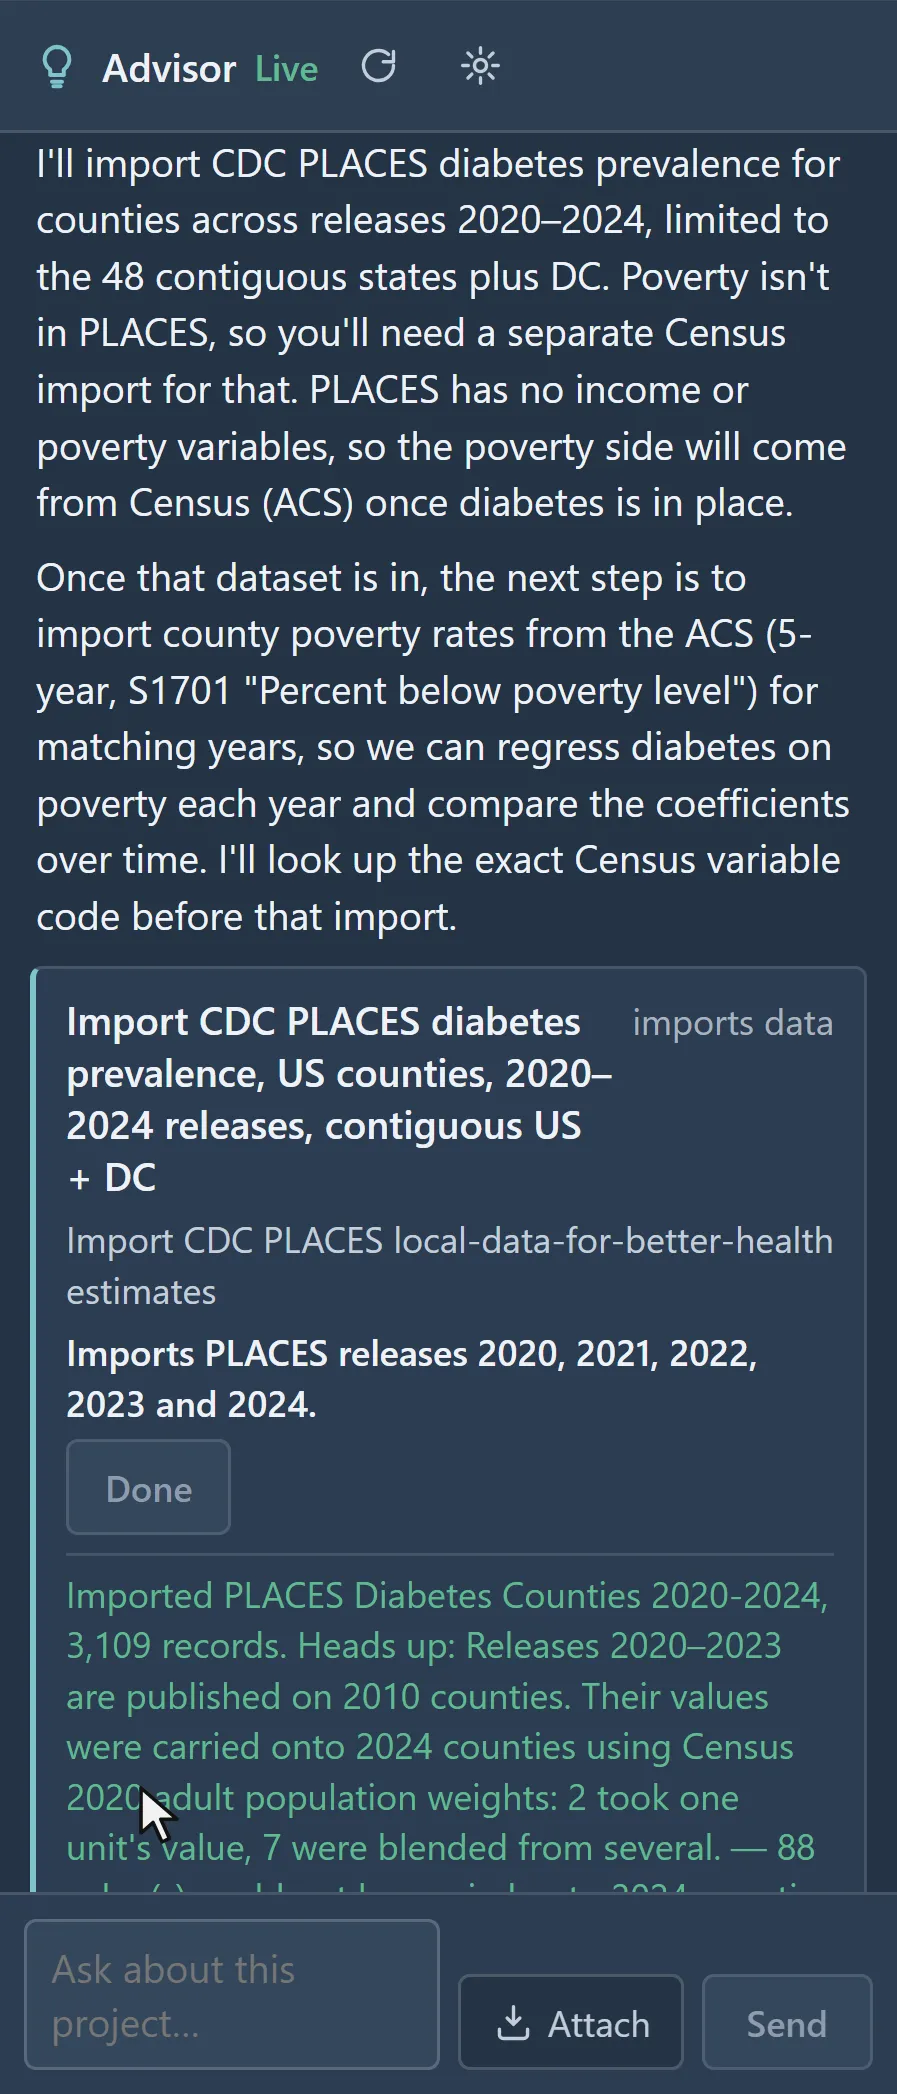
 The Advisor proposes the CDC PLACES diabetes import · U.S. counties, 2020–2024
Trained by a geostatisticianTrained by Pierre Goovaerts, Chief Scientist at BioMedware, to work as a geospatial specialist: method recommendations, caveats and worked examples drawn from 30 years of spatial statistics research.
Finds and imports the dataSearches the 25+ built-in sources for datasets that fit your research question and imports them at the right geography and years.
Recommends the right methodSuggests analysis methods tailored to your variables and your goal, and tells you why one fits better than another.
Guides you, or does it for youWalk through each step yourself, or ask it to run the method and build the visualizations from a plain-language request.
Honest about limitsFindings come with caveats: unstable rates in small populations, model assumptions, edge effects.
Works on your projectsThe Advisor edits projects you own or can edit. For a sample or view-only project, choose Make a copy first.
Runs on Amazon BedrockThe Advisor answers with Claude Haiku 5.5 on Amazon Bedrock. The Vesta server calls Bedrock under its own AWS role.
Export the conversationSave the full exchange as Word, PDF or Markdown for your methods notes, supervisor or IRB file.
The Advisor proposes the CDC PLACES diabetes import · U.S. counties, 2020–2024✦ Try asking the Advisor"Compare lung cancer incidence with radon levels across Pennsylvania counties, and tell me if the relationship varies by region."Runs on sample data in the trial workspace.
What's included
Natural-language chat in any languageClaude on Amazon BedrockDataset discoverySmart data importMethod recommendationStep-by-step guidanceRuns methods and builds visualizationsDOCX / PDF conversation export
Outbreak & cluster detectionFind where and when cases cluster with a space-time scan, and judge each cluster's significance by Monte Carlo replications.Health disparities & accessLink diabetes and other county outcomes to poverty and other measures from the Data Library, then map where the link is strongest and where high rates cluster.Risk factor modelingFit a regression of an outcome on its drivers, then check where the model fits well and where it does not. Logistic regression takes a 0/1 outcome, and GWR shows how each effect changes across the map.