


Geoscience, mining & soil
Defensible estimates from your samples, with the uncertainty attached.
For soil scientists, mining engineers, environmental engineers, geochemists and hydrogeologists. Model spatial structure, krige or co-krige your measurements, and map where each estimate is weakly supported, all in a browser.
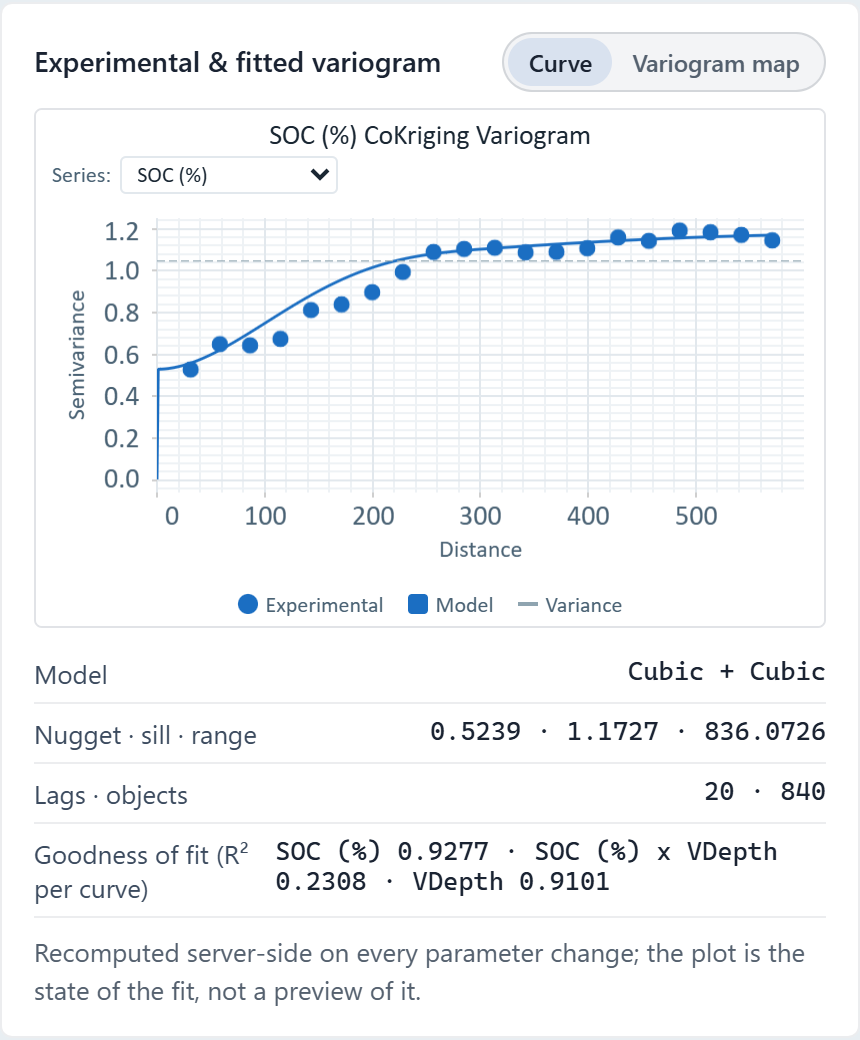
 Cokriging variogram · soil organic carbon, one Ontario field
The challenge
Samples are expensive and sparse, the variables are correlated or compositional, and every estimate has to hold up to a regulator, a client or a reviewer.
Step 1Import the samplesSoil cores, drill holes, wells or monitoring points as one dataset, with the measured variables as columns.How to: Importing data
Step 2Model the spatial structureFit a variogram: nugget, sill and range, with Auto trying Spherical, Exponential and Cubic. Turn on anisotropy for a major and minor range, or choose a compositional (logratio) value type for variables that are parts of a whole.How to: Variography
Step 3Krige and see where it is weakRun ordinary kriging for an estimate map and export it as GeoTIFF. The variance map shows where observations are few, and cross-validation checks the model against held-back data.How to: Kriging
Step 4Add a correlated variableFor co-kriging, add a covariate in Variography so Vesta fits direct and cross-variograms together, save the model and krige through it.How to: Co-kriging
Worked example · Soil organic carbon
How does soil organic carbon vary across one field, and where is the estimate least certain?
- Start from the samples840 soil samples (SOC, %) from one 26-hectare field in southern Ontario.How to: Importing data
- Fit the variogramAn auto-fitted model: nugget 0.52, plus a Cubic structure of 0.49 at 419 m and another of 0.16 at 825 m.How to: Variography
- Run ordinary krigingThe fitted variogram estimates SOC across the field as a kriged surface. Leave-one-out on that run gave an RMSE of 0.637 and a correlation of 0.783; the sample's summary does not display it, so cross-validate on your own data.How to: Kriging
- Read the variance mapThe kriging variance map shows where the estimate is weakly supported. It depends on where the samples are, not on their values.How to: Kriging
What it found
A kriged SOC surface and its variance map for the whole field, from a model with a nugget of 0.52 and structured variance of 0.49 and 0.16.
Distances in this project are computed in Web Mercator, which inflates them by about 1.38 at this latitude: the 825 m range is about 596 m on the ground. Over one field that is a uniform scale, so the kriged values are unaffected.
Kriged soil organic carbon · one Ontario field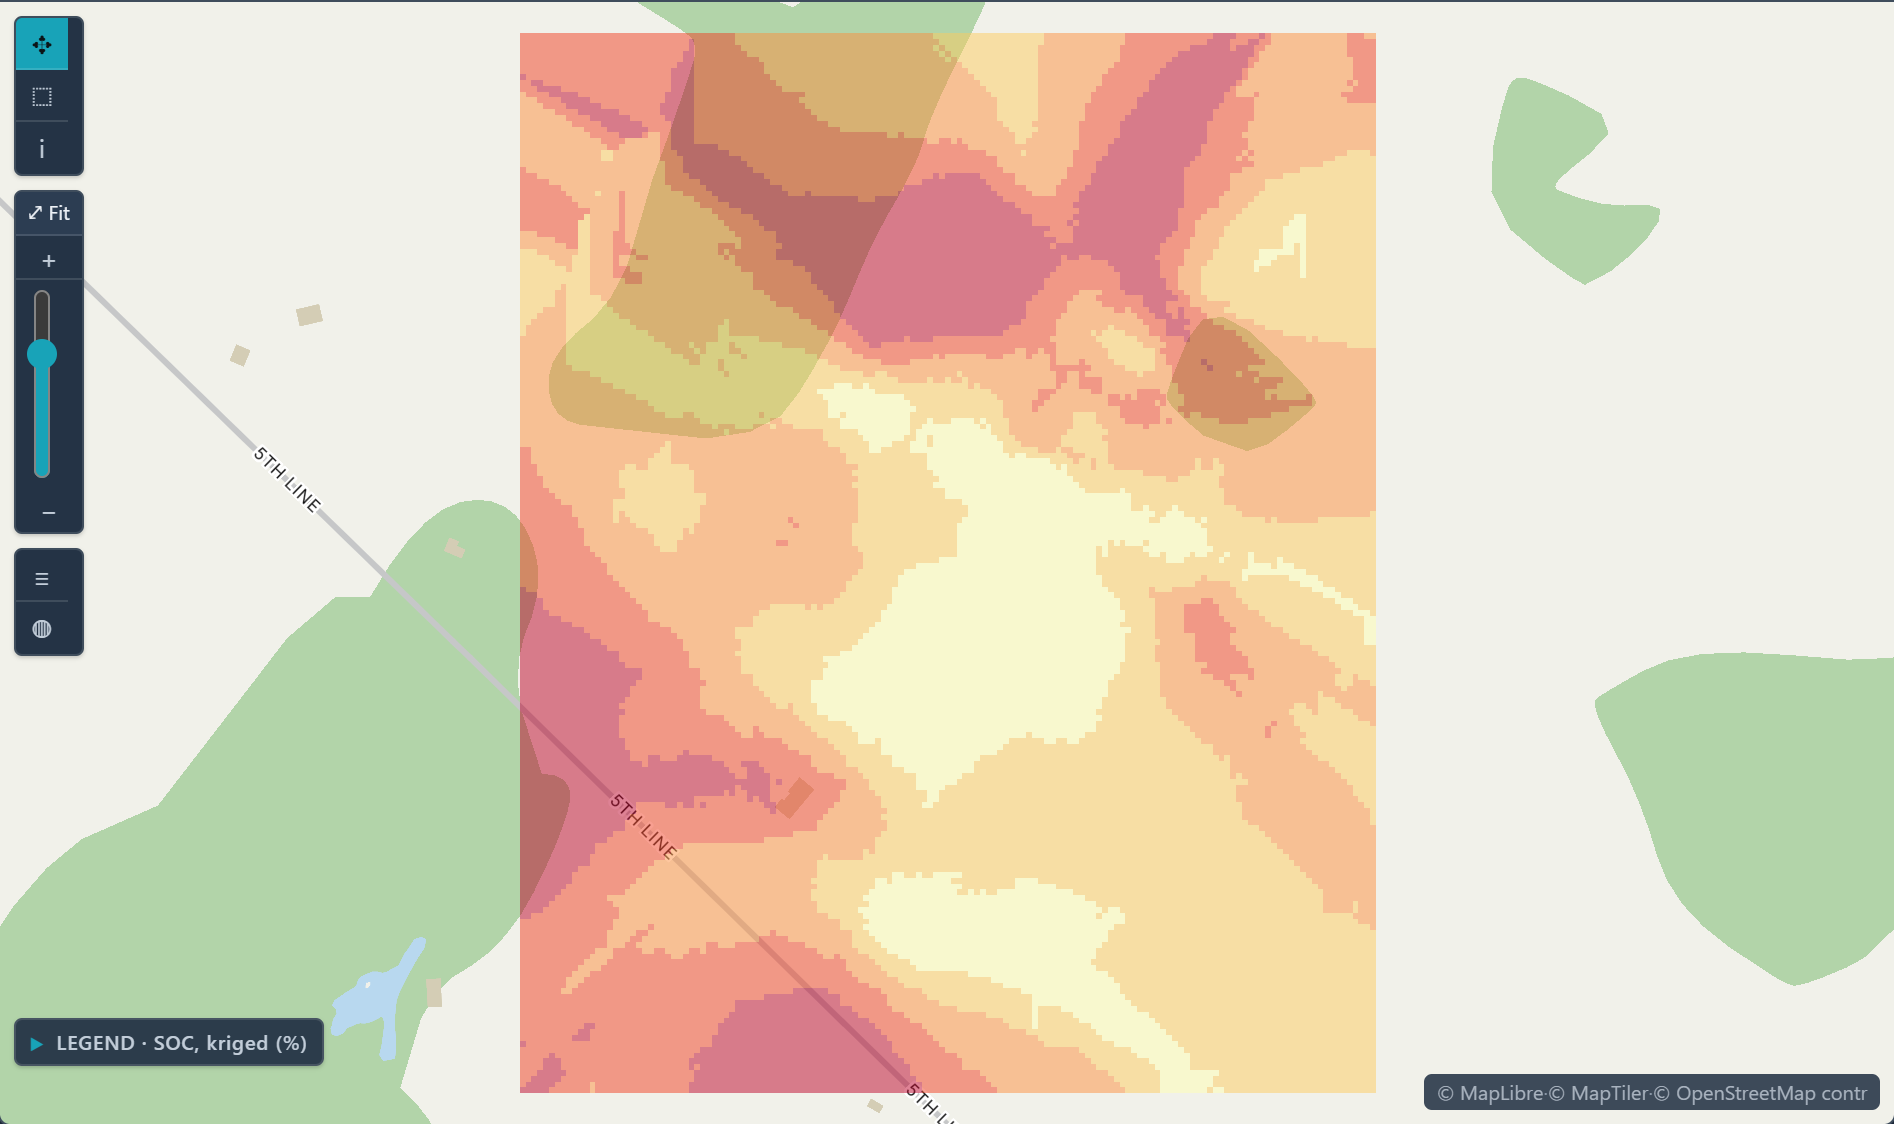
Open the sample projectRead-only · no sign-in
Read in the docs
Who it's for
Soil scientistsMap soil properties such as organic carbon, and see where the estimates are weakest.
Mining engineersEstimate grade across a deposit from drill-hole assays, with co-kriging for a correlated variable.
Environmental engineersMap contaminant concentrations and the probability of exceeding a regulatory limit.
GeochemistsModel compositional data in logratio space, with a compositional variogram.
HydrogeologistsInterpolate groundwater levels and quality from wells; with measurements at several times, fit a space-time variogram.
Methods
KrigingCo-krigingIndicator krigingCompositional (logratio) variogramsSpace-time variogramsAnisotropyCross-validation
Data
Your sample data
Evidence
Published research by BioMedware scientistsGeostatistical modelling of uncertainty in soil scienceGoovaerts, P. Geoderma 103, 2001.
See every sample project