


Disease surveillance over time
Watch trends shift across places and years.
Combine joinpoint regression, space-time kriging and the workspace time slider to see where rates rose, when the trend changed, and how the pattern moved.
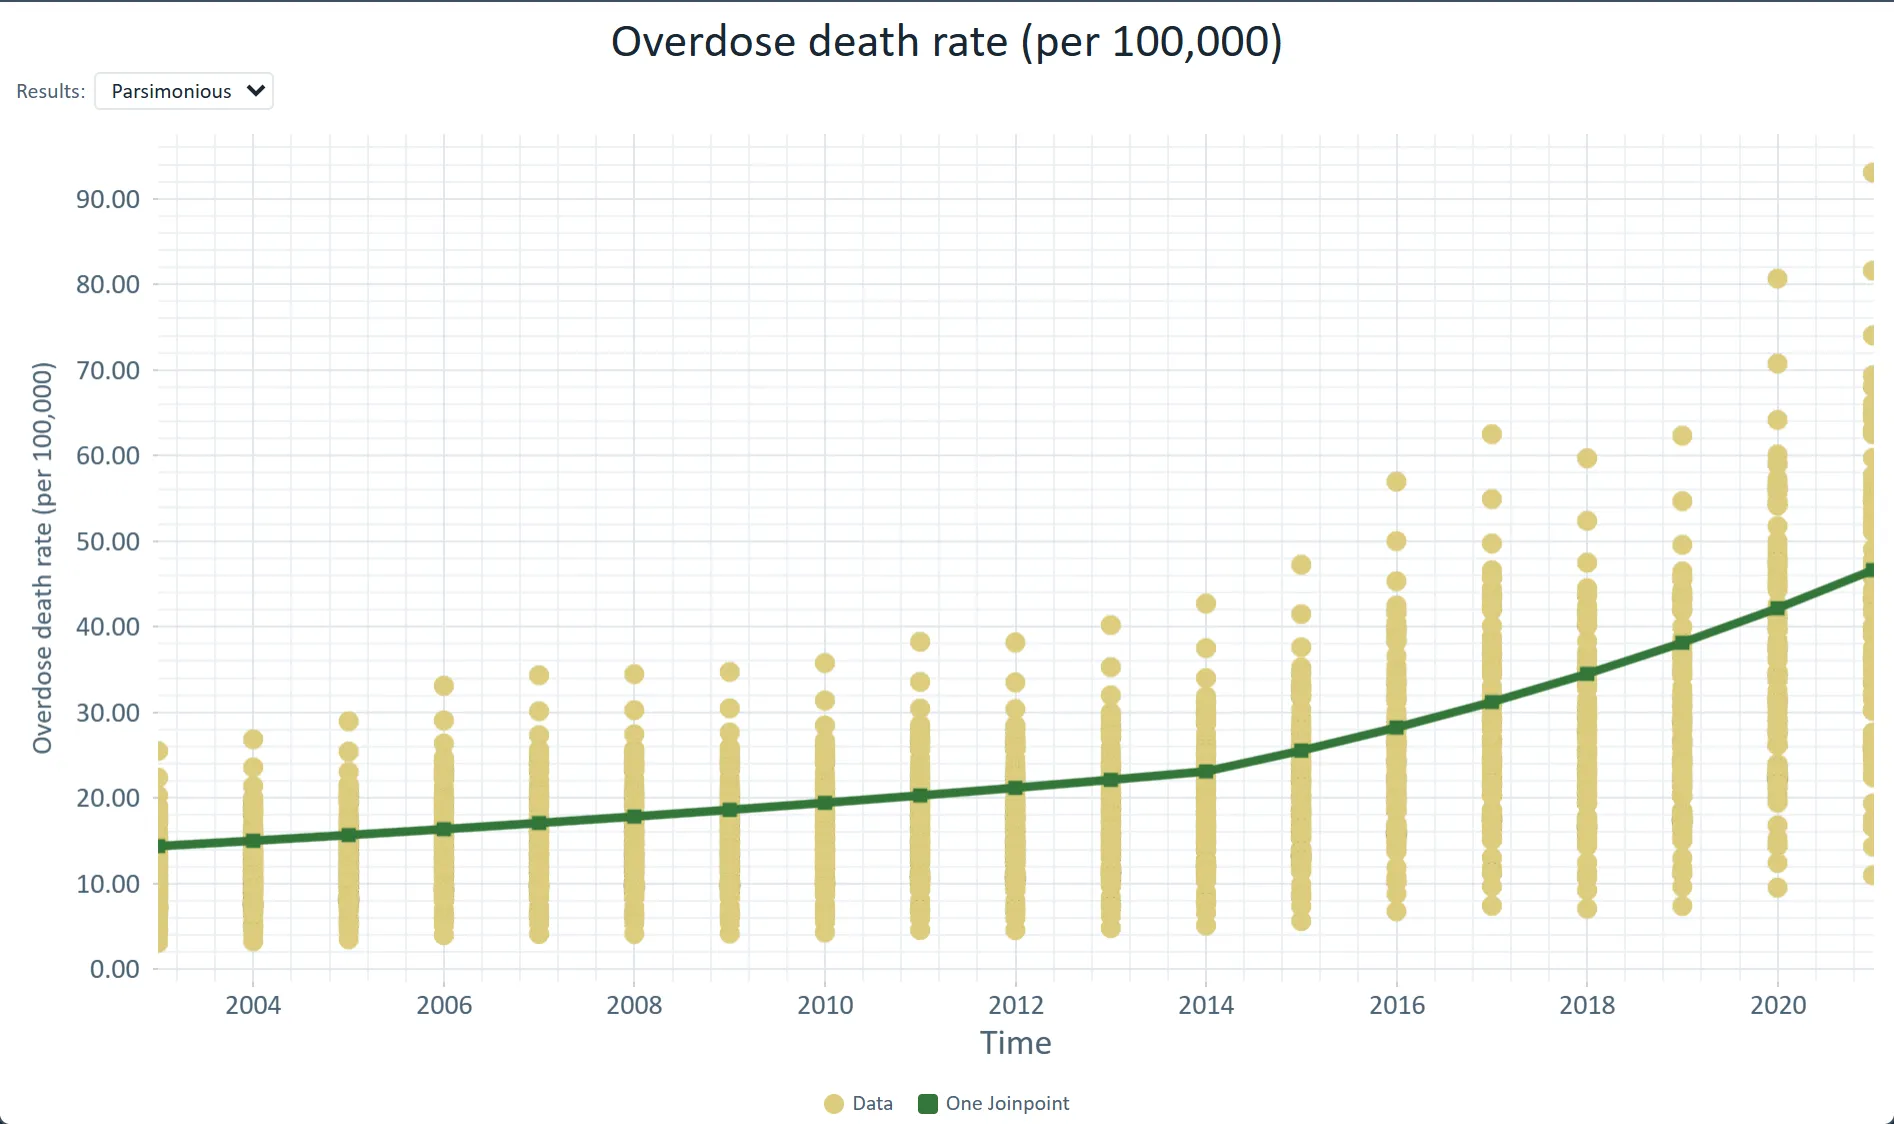
 County overdose death rates with the statewide joinpoint trend (2014) · Ohio, 2003–2021
The challenge
Annual reports show state totals; you need to see when the trend changed, how fast it rose or fell on each side of the change, and how the pattern moved over the years.
Step 1Pull the seriesAdd Drug Poisoning Mortality by county and year from the Data Library, or import your own registry file.How to: Data Library
Step 2Find the turning pointsJoinpoint regression fits segments to the trend and reports the year it changed and each segment's annual percent change.How to: Joinpoint regression
Step 3Model the space-time surfaceFit a space-time variogram in Variography with the Spatio-temporal option, save it, and krige the rates through it.How to: Variography
Step 4Read the yearsStep the workspace time slider through the years; the maps and the Statistics panel move with it.How to: The workspace
Worked example · Ohio overdose trends
How fast did Ohio's overdose death rate rise from 2003 to 2021, and when did the trend change?
- Start from the county series88 Ohio counties with overdose death rates per 100,000 from 2003 to 2021, combined into one statewide series.How to: Joinpoint regression
- Find the trend changeA log-linear joinpoint model with heteroscedastic errors chose one joinpoint, in 2014.How to: Joinpoint regression
- Fit the space-time structureA space-time variogram with two Cubic structures, a largest range of 420 km and a temporal range of 13.5 years; then ordinary kriging of the rates.How to: Variography
What it found
Statewide, the rate rose about 4.4% a year from 2003 to 2014 and about 10.6% a year from 2014 to 2021, an average of 6.79% a year.
Every county grows at the same rate in this NCHS release (7.48% a year), so the data cannot show which county rose fastest, and the series ends in 2021.
Space-time kriged death rate surface · Ohio, 2021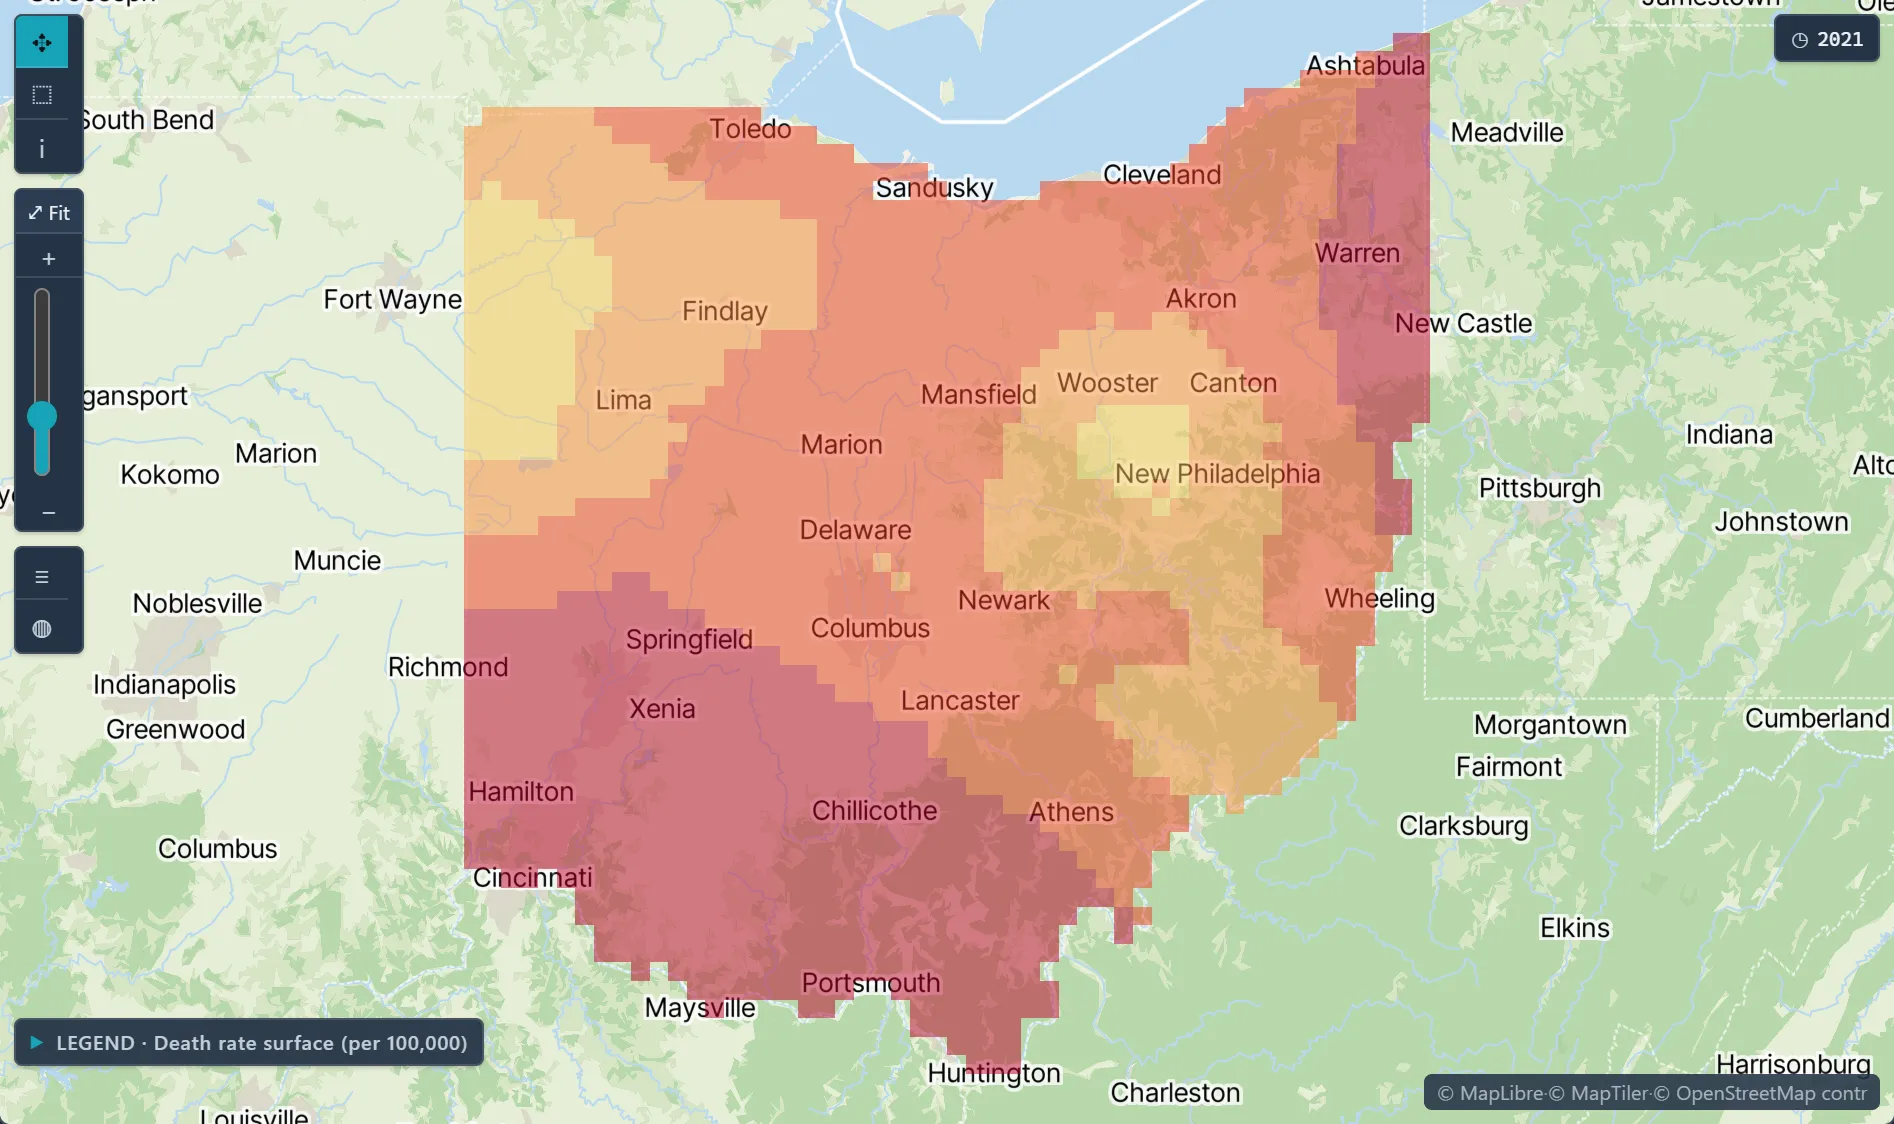
Open the sample projectRead-only · no sign-in
Read in the docs
Methods
Joinpoint regressionSpace-time variogramKrigingSpace-time scan
Data
CDC Drug Poisoning MortalityCDC BRFSSYour registry data
Evidence
Published research by BioMedware scientistsAnalysis of geographical disparities in temporal trends of health outcomes using space-time joinpoint regressionGoovaerts, P. Int. J. Applied Earth Observation and Geoinformation 22, 2013.
See every sample project