


Video tutorials
Short screen recordings of Vesta, from a first look at the workspace to geographically weighted regression. Watch one before you try a method for the first time.
9 shown
 Ohio overdose trends · death rate surface, 2021
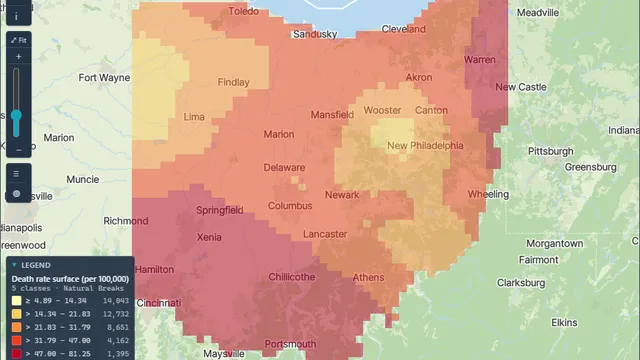
OverviewVesta in two minutesSpace-time analysis with the Advisor, from question to map.
 2:30
OverviewA first look at the workspaceThe Advisor panel, the Data View and the sidebar that takes you from import through preprocessing, visualization and analysis.
 4:54
DataQuick data importPull PM2.5 and asthma emergency department visit rates from CDC tracking data, then add poverty, uninsured and population from the Census.
 2:25
DataExploring and visualizing your dataA map, histogram, box plot, time series and statistics in one click; select an outlier on a chart and see it on the map.
 3:08
MethodsLocal cluster analysis in three clicksTest whether a mapped pattern is real, with no spatial weights matrix to build, on PM2.5 and asthma visits.
 3:27
MethodsRegression and checking the residualsModel asthma visits against PM2.5, poverty, uninsured and population, then test the residuals for spatial pattern.
 4:18
MethodsGeographically weighted regressionLet a relationship vary by place, check the bandwidth first, and read the coefficient maps with care.
 2:20
DataData sources for public health and demographicsCDC PLACES, Drug Poisoning Mortality, BRFSS, the Census American Community Survey and World Bank population data.
 2:00
DataData sources for veterinary and environmental workWAHIS disease surveillance, FAOSTAT, Gridded Livestock of the World, and MODIS temperature and vegetation layers.