


Public health departments
Answer the board's question this week.
Small epidemiology teams use Vesta Online to pull public county series, find where a trend changed and map the results, without writing code.
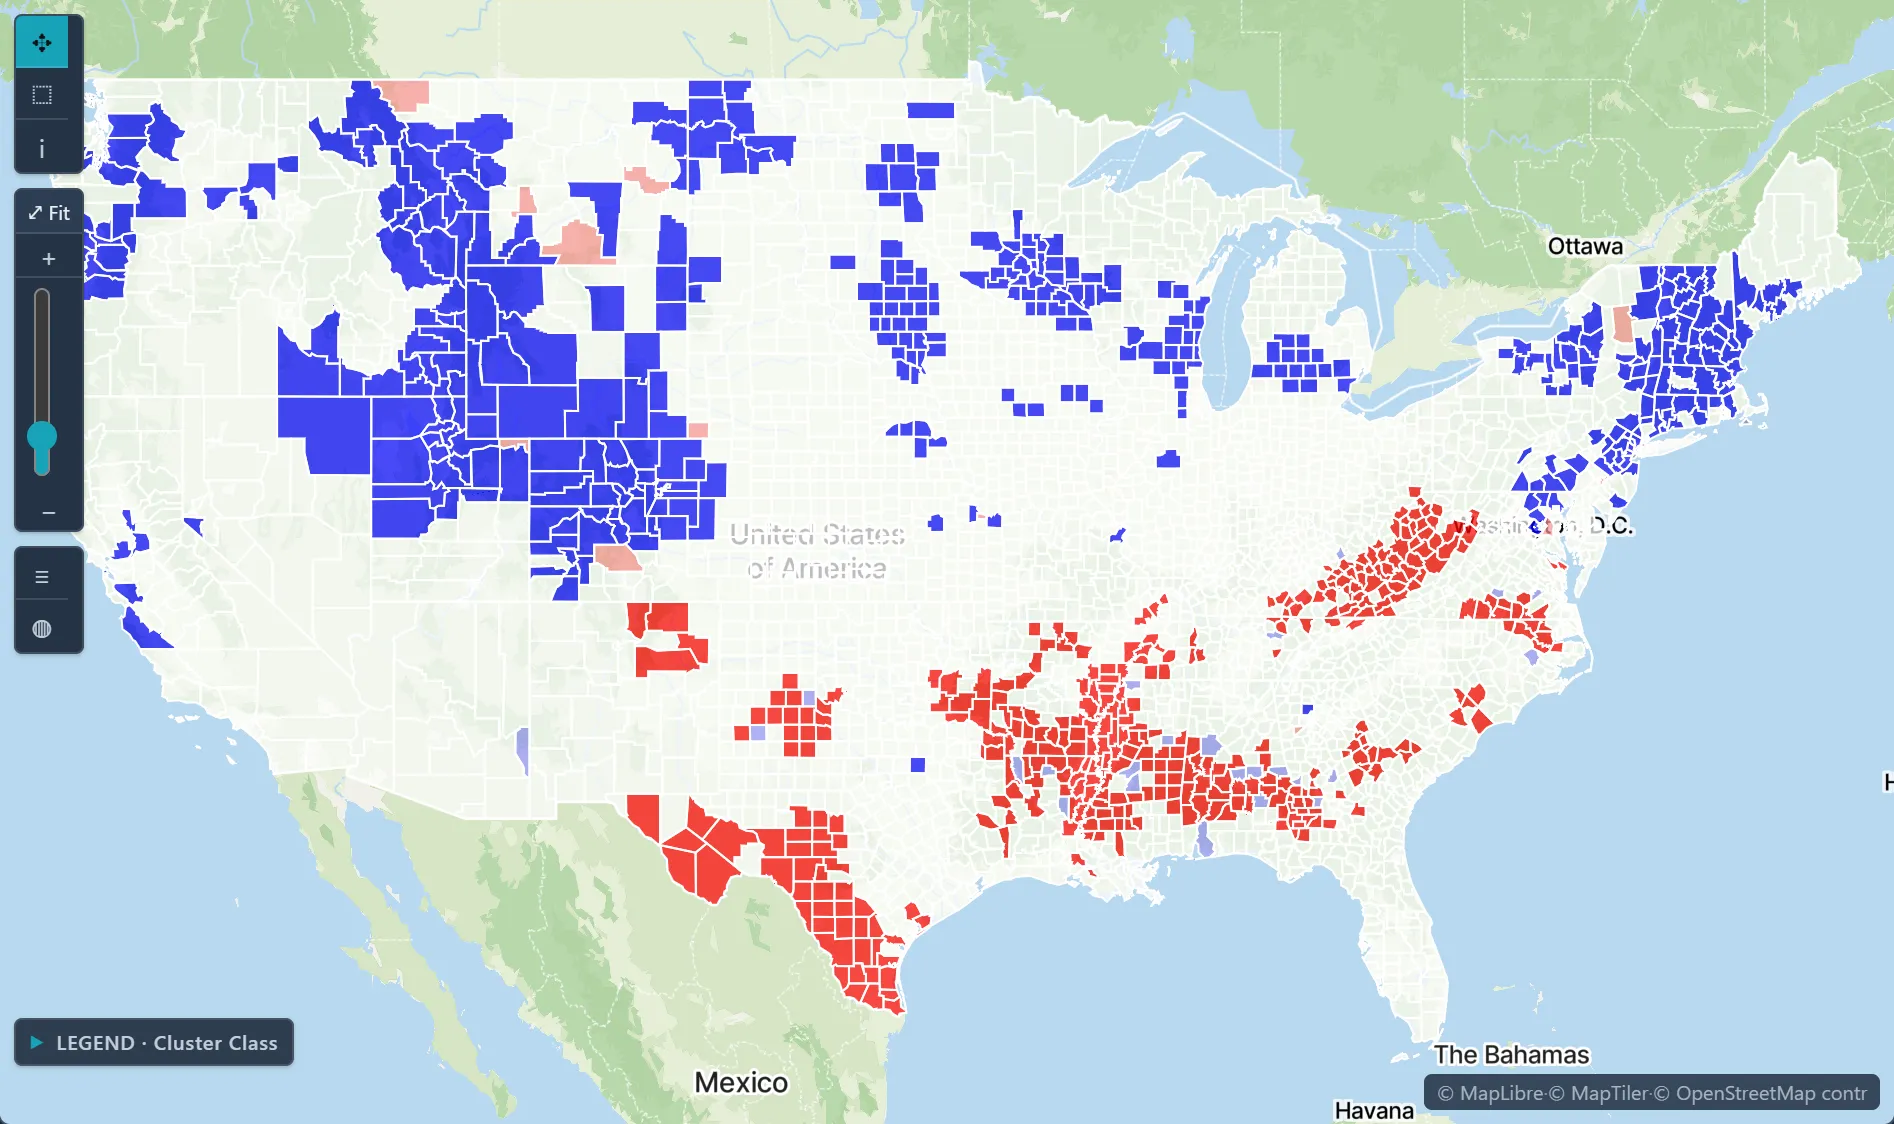
 Local Moran's I clusters · diabetes among U.S. adults, by county
The challenge
Too many data sources, too few analysts, and leadership that needs a clear answer with honest caveats.
Step 1Pull the county seriesAdd Drug Poisoning Mortality by county from the Data Library, or import your own county file.How to: Data Library
Step 2Find the turning pointsJoinpoint regression fits straight segments to the trend and reports the year it changes and the annual percent change of each segment.How to: Joinpoint regression
Step 3Model the space-time surfaceFit a space-time variogram in Variography with the Spatio-temporal option, then krige the rates through it.How to: Variography
Step 4Brief leadershipExport the results and a report for leadership, and share the project read-only with colleagues; colleagues without a Vesta account get a read-only link.How to: Exporting data and pictures
Worked example · Ohio overdose trends
When did Ohio's overdose death rate change pace from 2003 to 2021, and how fast did it rise on either side of the change?
- Start from the county series88 Ohio counties with overdose death rates per 100,000 from 2003 to 2021, combined into one statewide series.How to: Data Library
- Find the trend changeA log-linear joinpoint model with heteroscedastic errors chose one joinpoint, in 2014.How to: Joinpoint regression
- Fit the space-time structureA space-time variogram with two Cubic structures, a largest range of 420 km and a temporal range of 13.5 years; then ordinary kriging of the rates.How to: Variography
What it found
Statewide, the rate rose about 4.4% a year from 2003 to 2014 and about 10.6% a year from 2014 to 2021, an average of 6.79% a year.
The series ends in 2021. In this NCHS release every county grows at the same rate (7.48% a year), so the data cannot show which county rose fastest.
Space-time kriged death rate surface · Ohio, 2021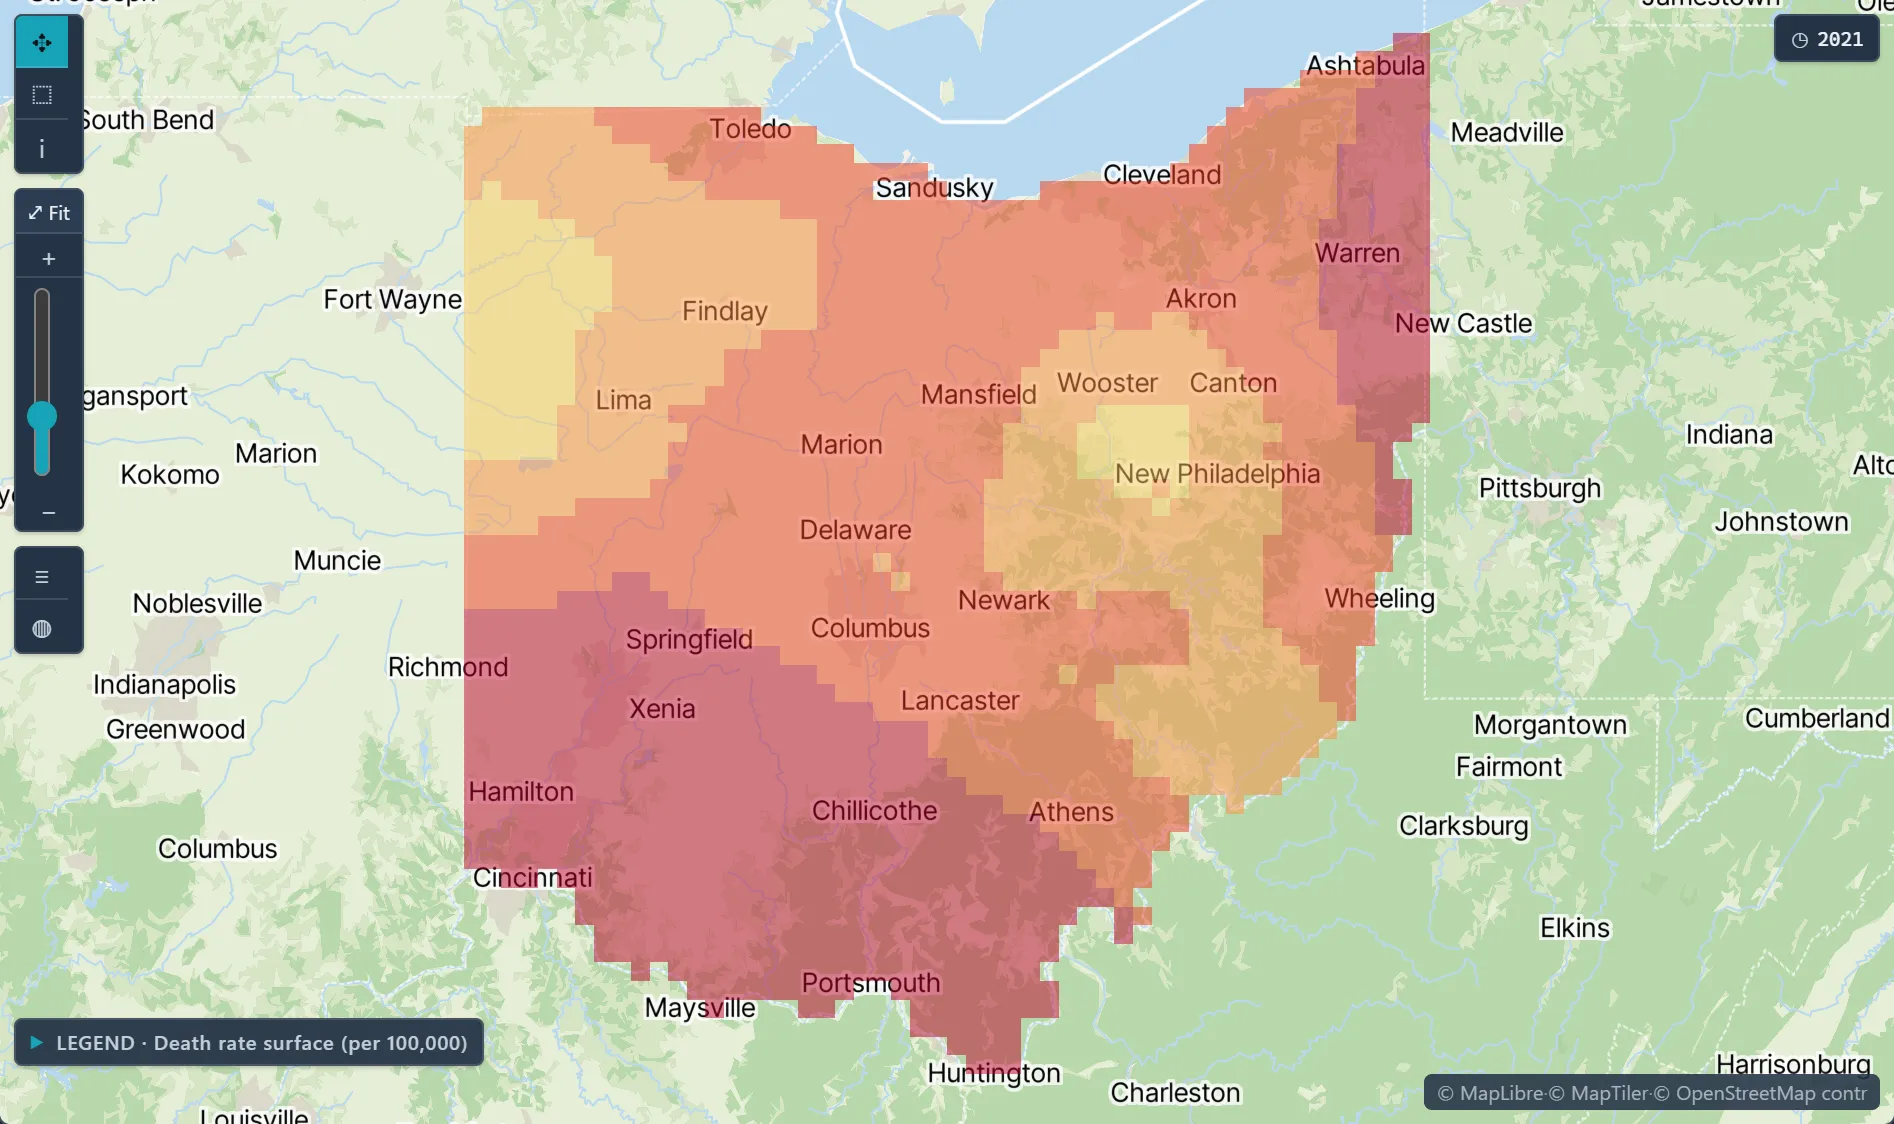
Open the sample projectRead-only · no sign-in
Read in the docs
Methods
Cluster detectionJoinpointSpace-time interpolationGWR
Data
CDC PLACESBRFSSDrug Poisoning MortalityACS
Evidence
Published research by BioMedware scientistsSpatial analysis of drug poisoning deaths in the American West, particularly UtahKerry, R., Goovaerts, P., Vowles, M., Ingram, B. International Journal of Drug Policy 33, 2016.
See every sample project