


 Space-Time Visualization
See change as it happens.
Animate any variable across time, and select anything, anywhere: a selection on the map highlights the same places in every chart and table. Grid, Focus and Compare layouts keep several views in front of you.
 Overdose death rate per 100,000 by county · Ohio, 2021
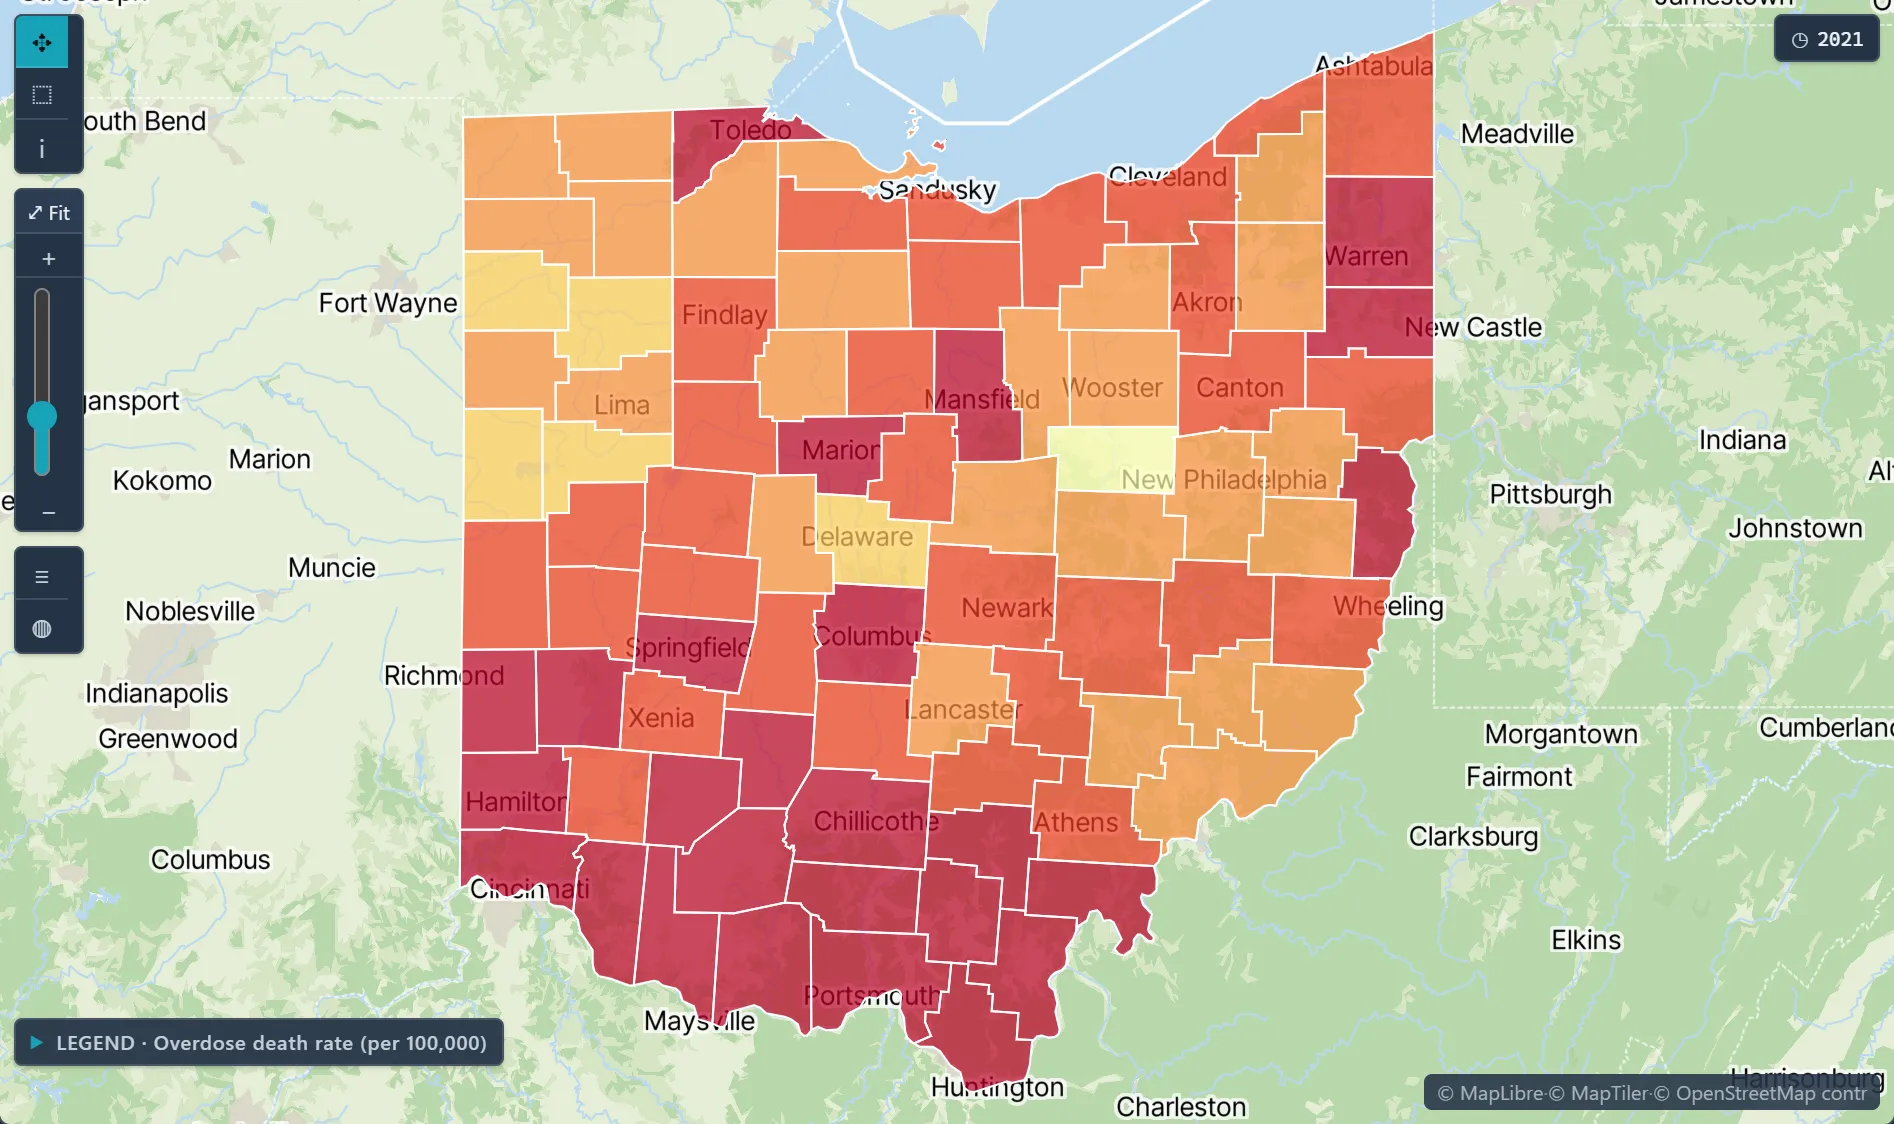
Animation across time and spacePlay a variable through years, months or weeks, or step through frame by frame.
Linking and brushingSelections sync across every map, chart and table in the workspace.
Grid, Focus and CompareSwitch layouts to scan many views or compare two side by side.
Full chart setHeatmaps, time plots, scatterplots, histograms, box plots, correlation matrices, 3D scatter and ST-variogram surfaces.
Histogram linked to a map selection · diagnosed diabetes, U.S. counties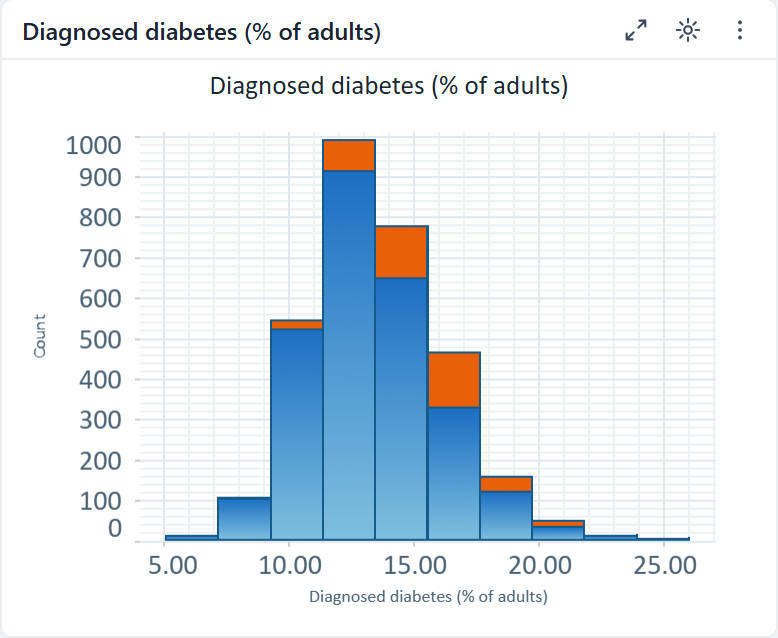
✦ Try asking the Advisor"Animate county unemployment from 2008 to 2020 and show the distribution next to the map."Runs on sample data in the trial workspace.
What's included
2D map & heatmapTime plotScatterplot & 3D scatterHistogram & box plotCorrelation matrixTrend line & forecastAnimationLinking & brushing
Disease surveillance over timeCombine joinpoint regression, space-time kriging and the workspace time slider to see where rates rose, when the trend changed, and how the pattern moved.Exposure & contamination mappingInterpolate contaminant levels from monitoring sites into a continuous surface, and map the probability of exceeding a regulatory threshold alongside every estimate.Health disparities & accessLink diabetes and other county outcomes to poverty and other measures from the Data Library, then map where the link is strongest and where high rates cluster.