


Environmental health & exposure science
Connect exposures to outcomes, place by place.
Interpolate exposure from monitoring networks, then relate it to health outcomes with regression that lets the relationship vary across space.
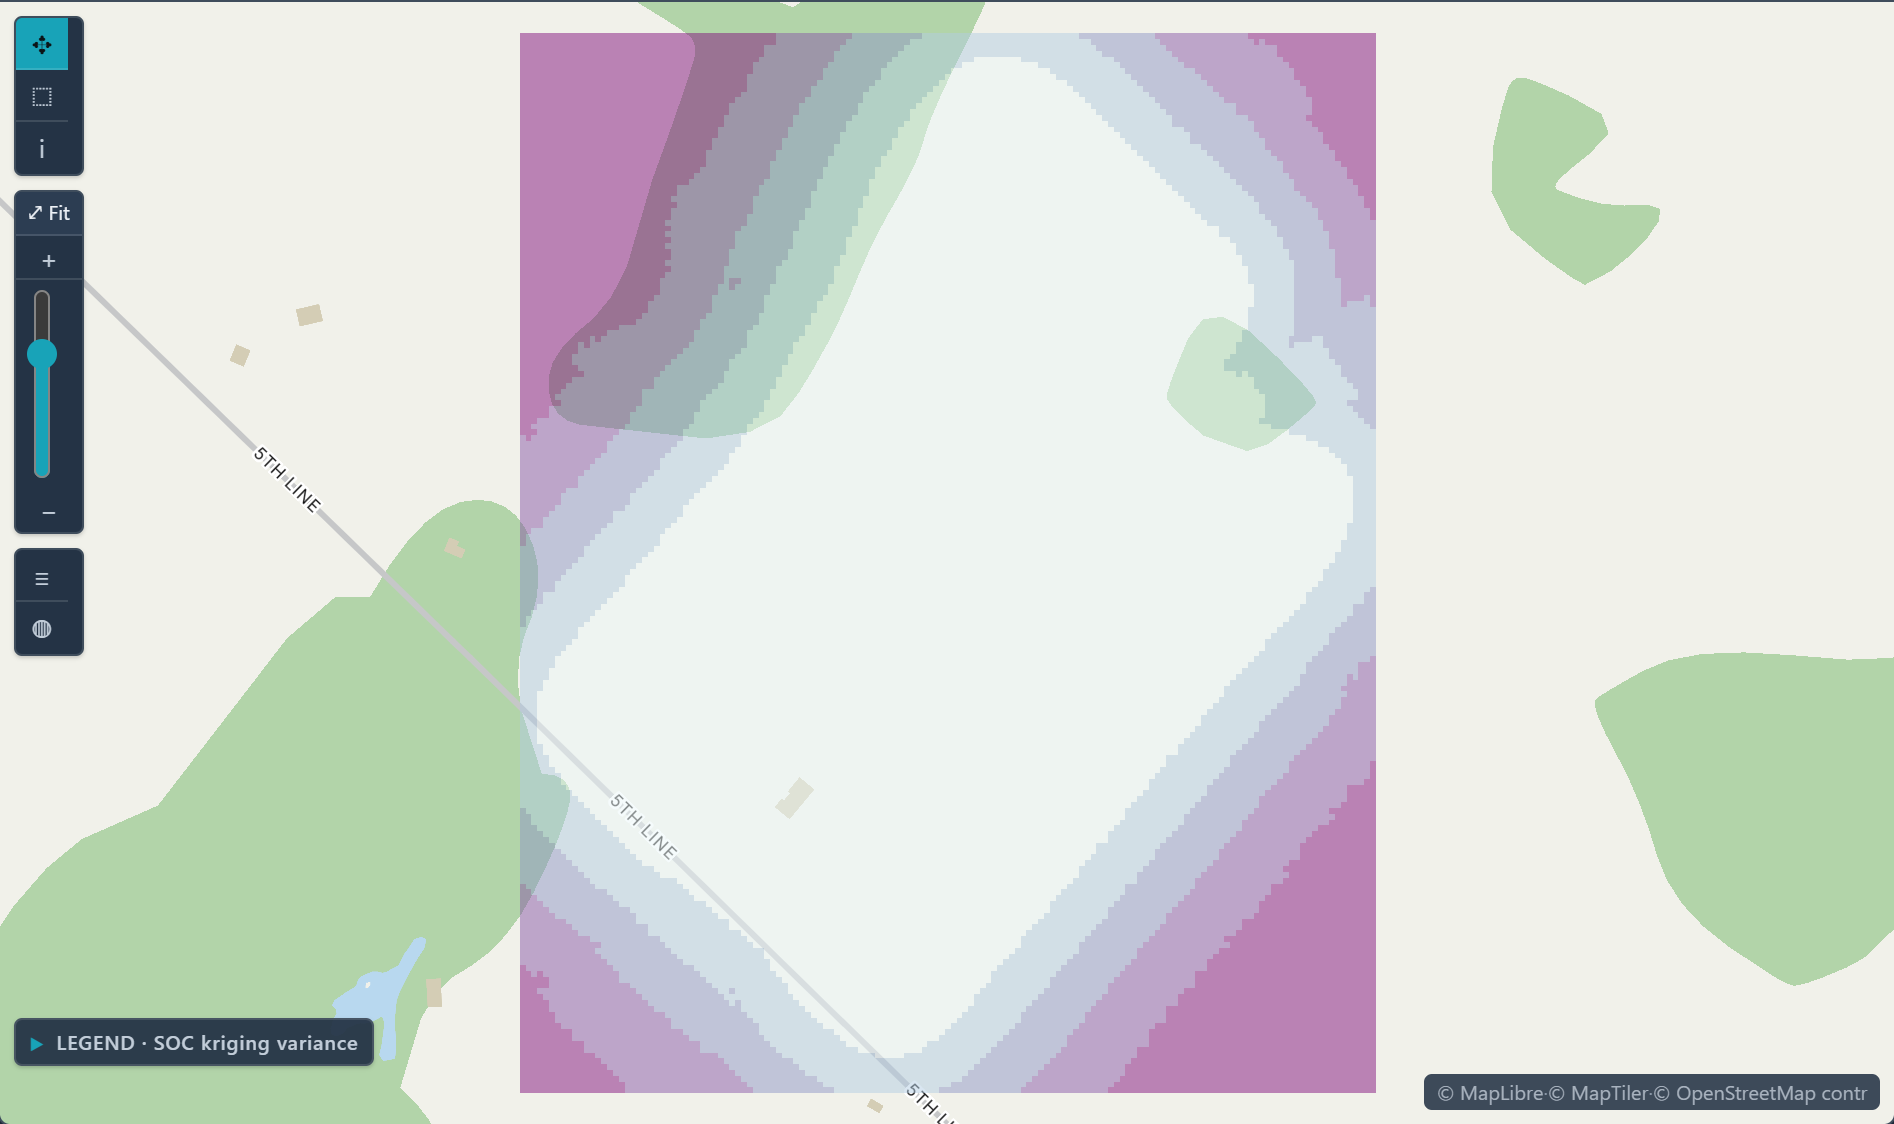
 Kriging variance · where the soil carbon estimate is less certain
The challenge
Exposure is measured at points; outcomes are reported by area. Linking them is where most of the effort goes.
Step 1Import the monitoring resultsUpload one row per well or site with its location and concentration, plus a 0/1 column for above the limit, computed before import.How to: Importing data
Step 2Krige the exposureKrige the concentrations for an estimate map, and krige the 0/1 column with indicator kriging for the probability above the limit; the variance map shows where either is weakly supported.How to: Kriging
Step 3Match the outcomes by areaAdd CDC PLACES or CDC EPH Tracking measures from the Data Library, and use Change of scale when the two datasets use different geographies.How to: Data Library
Step 4Model the link and deliverFit OLS, then GWR, of the outcome on exposure, check the residual Moran's I, and export the results as GeoTIFF and as a report.How to: Regression and GWR
Worked example · Well-water arsenic
How likely is arsenic above the 10 µg/L limit at places between the wells in Salt Lake County?
- Start from the wellsThe sample holds 186 wells with per-well medians since 1991; non-detects were set at half the reporting limit and co-located wells merged.How to: Importing data
- Mark the limitA 0/1 column marks each well above 10 µg/L, the WHO guideline and U.S. EPA limit; 29.6% of the wells are above it.
- Krige the indicatorIndicator kriging onto a raster grid estimates the probability that arsenic exceeds 10 µg/L at every cell.How to: Kriging
- Check it against held-back wellsLeave-one-out validation reached 83.3% accuracy against a 70.4% baseline, in the sample's build run.How to: Kriging
What it found
The map shows the probability highest around West Valley City and Kearns, and lower toward the east and south. Cells far from any well carry the least support.
The 83.3% comes from the script that built the sample; run Validation in Kriging on your own data to check it. A probability is an estimate from 186 wells, not a lab result.
Probability well water exceeds 10 µg/L arsenic · Salt Lake County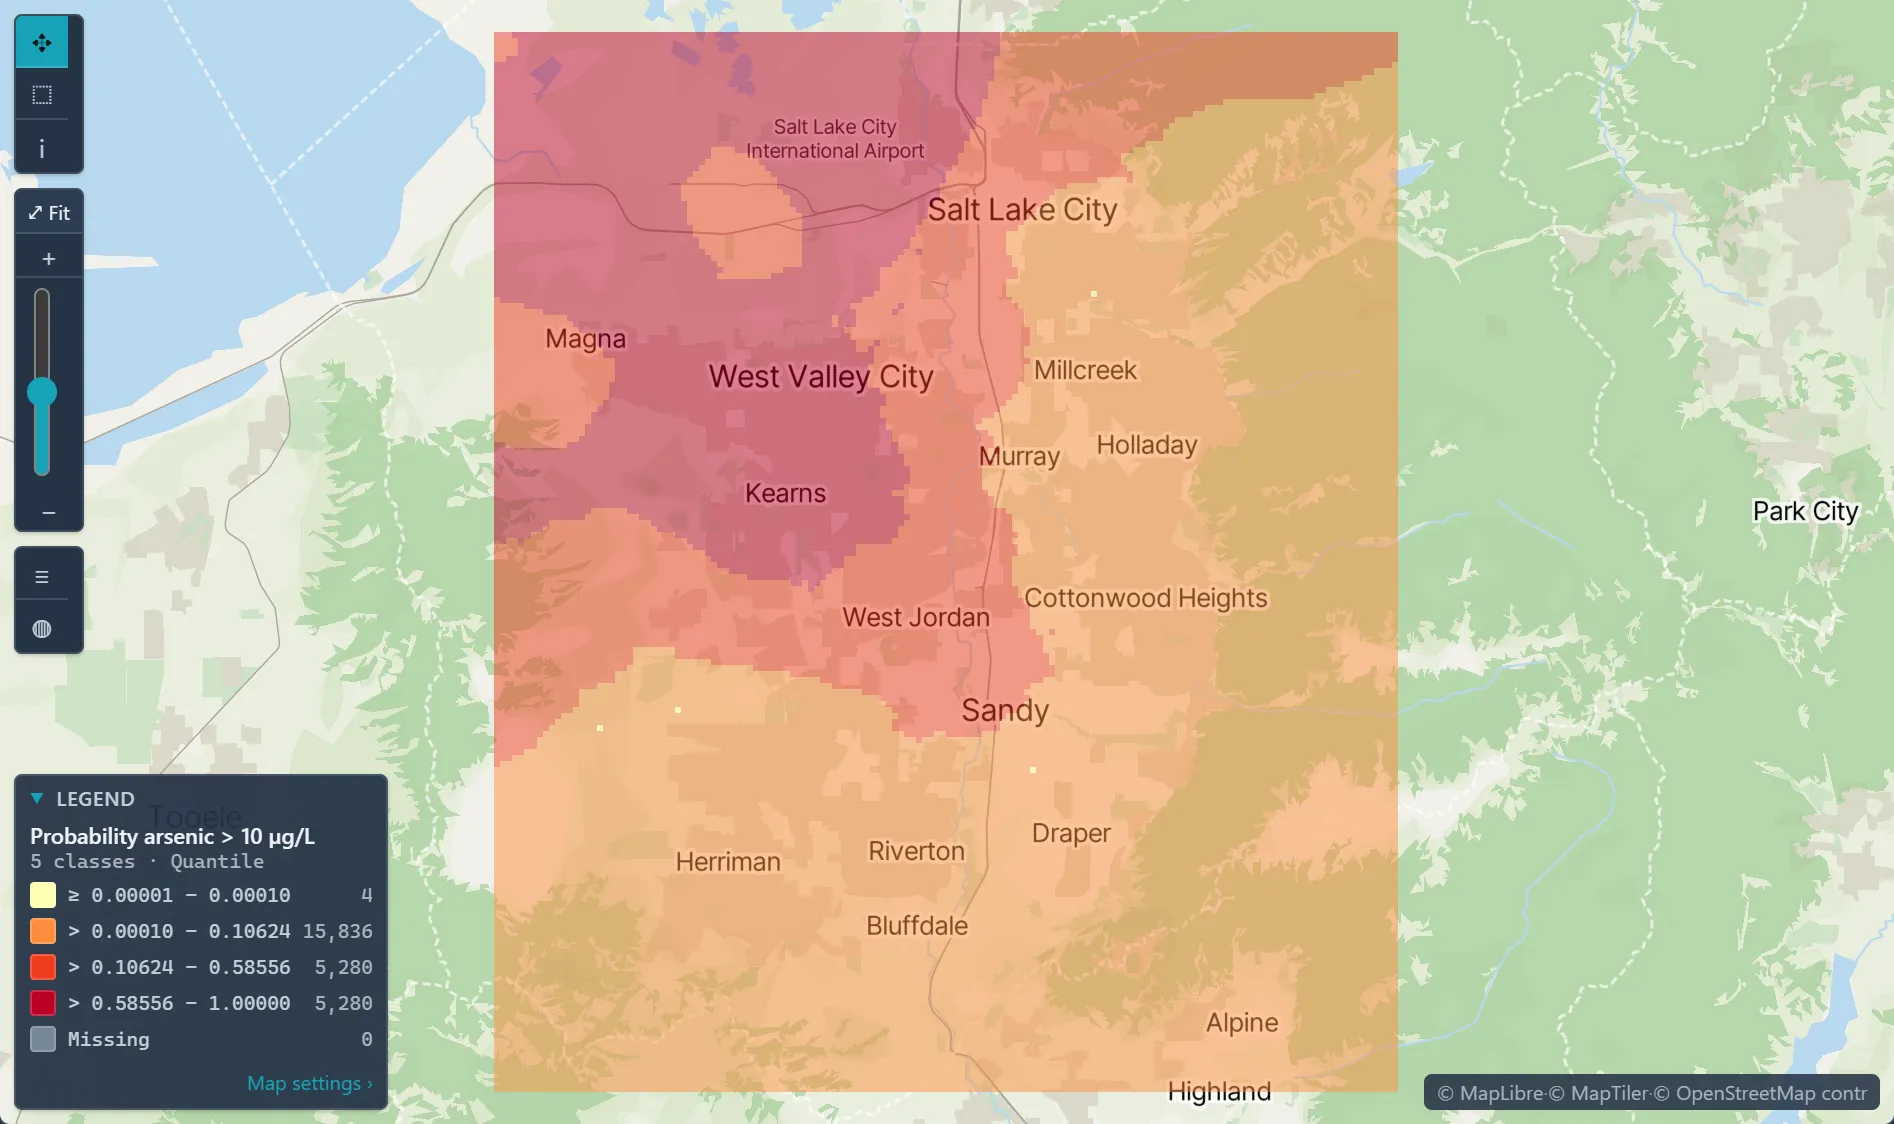
Open the sample projectRead-only · no sign-in
Read in the docs
Methods
KrigingIndicator krigingGWROLS
Data
CDC EPH TrackingCDC PLACESYour monitoring data
Evidence
Customer storyMonitoring lead levels in Flint, MichiganThe analysis identified the housing units with the highest probability of having service lines made of hazardous materials, giving replacement programs a ranked list to work from.
Published research by BioMedware scientistsSpace-time distribution of trichloroethylene groundwater concentrations: Geostatistical modeling and visualizationGoovaerts, P., Rihana-Abdallah, A., and Y. Pang Mathematical Geosciences 56, 2024.
See every sample project