


 Cluster & Hotspot Detection
Is it a cluster, or just noise?
Local Moran's I, spatial and space-time scan statistics, Q-statistics for case-control data, and space-time interaction tests identify significant hot spots, cold spots and outliers, with Monte Carlo significance testing and maps ready to share.
 Local Moran's I clusters · diabetes among U.S. adults, by county
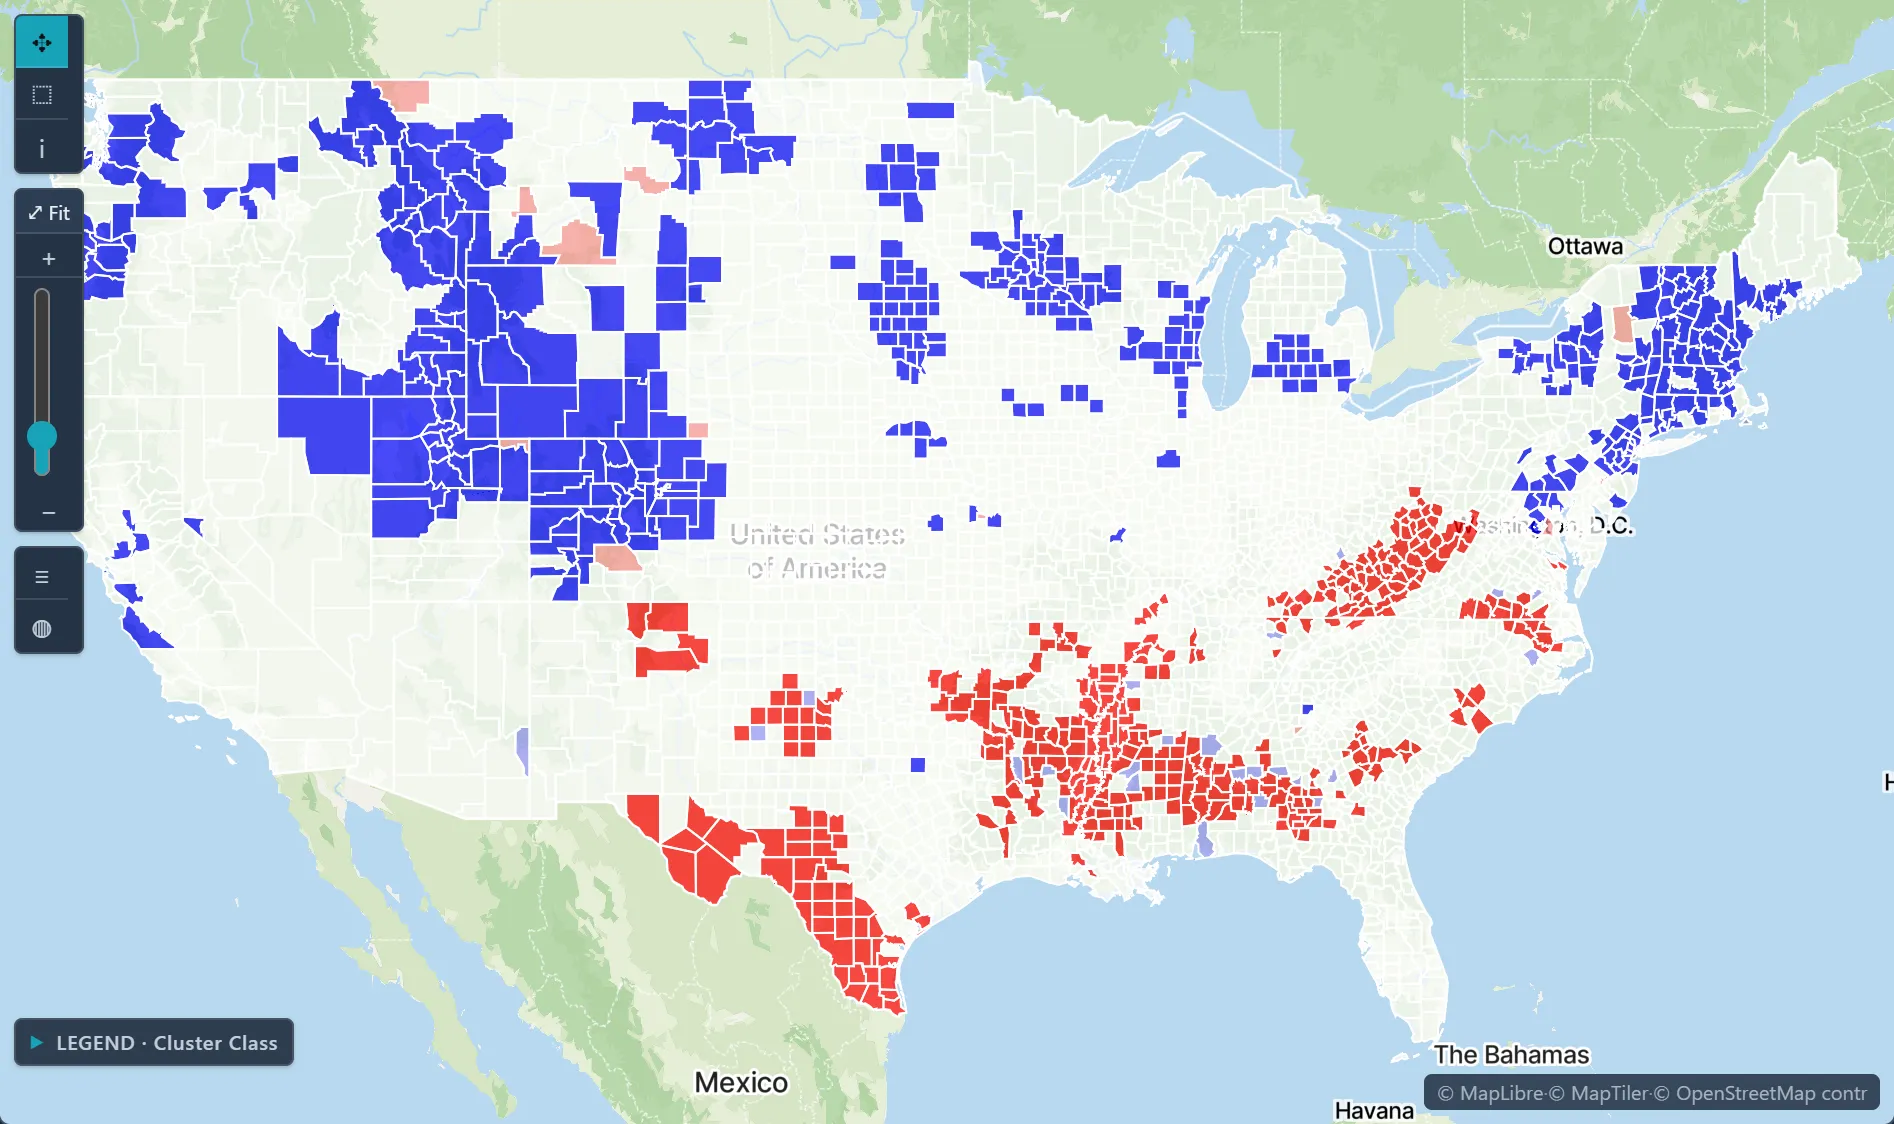
Complementary methodsLISA for local autocorrelation; spatial, multinomial and space-time scans for clusters that emerge over time; Knox, Jacquez k-NN and direction tests for space-time interaction.
Case-control clustering with Q-statisticsFollow every person through space and time, residential histories included, and test whether cases stay near other cases rather than near controls.
Significance you can defendMonte Carlo p-values and clear reporting of the neighbour definition and number of permutations.
Watch clusters emergeAnimate results week by week or year by year to see when a cluster started.
Linked to everythingSelect a cluster on the map and the same locations highlight in every chart and table.
Histogram of diagnosed diabetes among U.S. adults, by county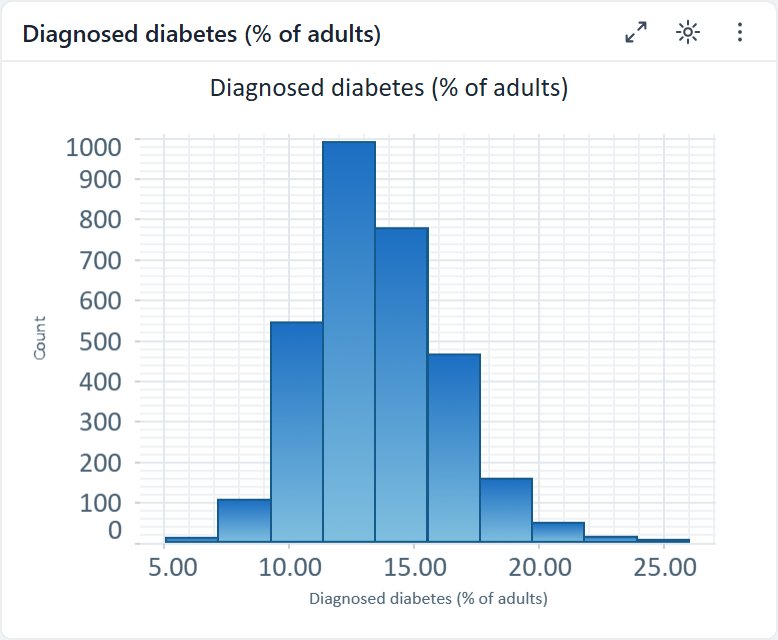
✦ Try asking the Advisor"Are there significant clusters of Lyme disease cases by ZIP code this summer compared with the last five years?"Runs on sample data in the trial workspace.
What's included
Local Moran's I (LISA)Spatial scan (Poisson, Bernoulli, multinomial)Space-time scanQ-statisticsKnox testJacquez k-NN testDirection testMonte Carlo p-values
Outbreak & cluster detectionFind where and when cases cluster with a space-time scan, and judge each cluster's significance by Monte Carlo replications.Disease surveillance over timeCombine joinpoint regression, space-time kriging and the workspace time slider to see where rates rose, when the trend changed, and how the pattern moved.Health disparities & accessLink diabetes and other county outcomes to poverty and other measures from the Data Library, then map where the link is strongest and where high rates cluster.