


Sampling design
Put the next sample where it tells you the most.
Use the variogram range and the uncertainty map to see where your current samples leave the most uncertainty, and plan new locations there.
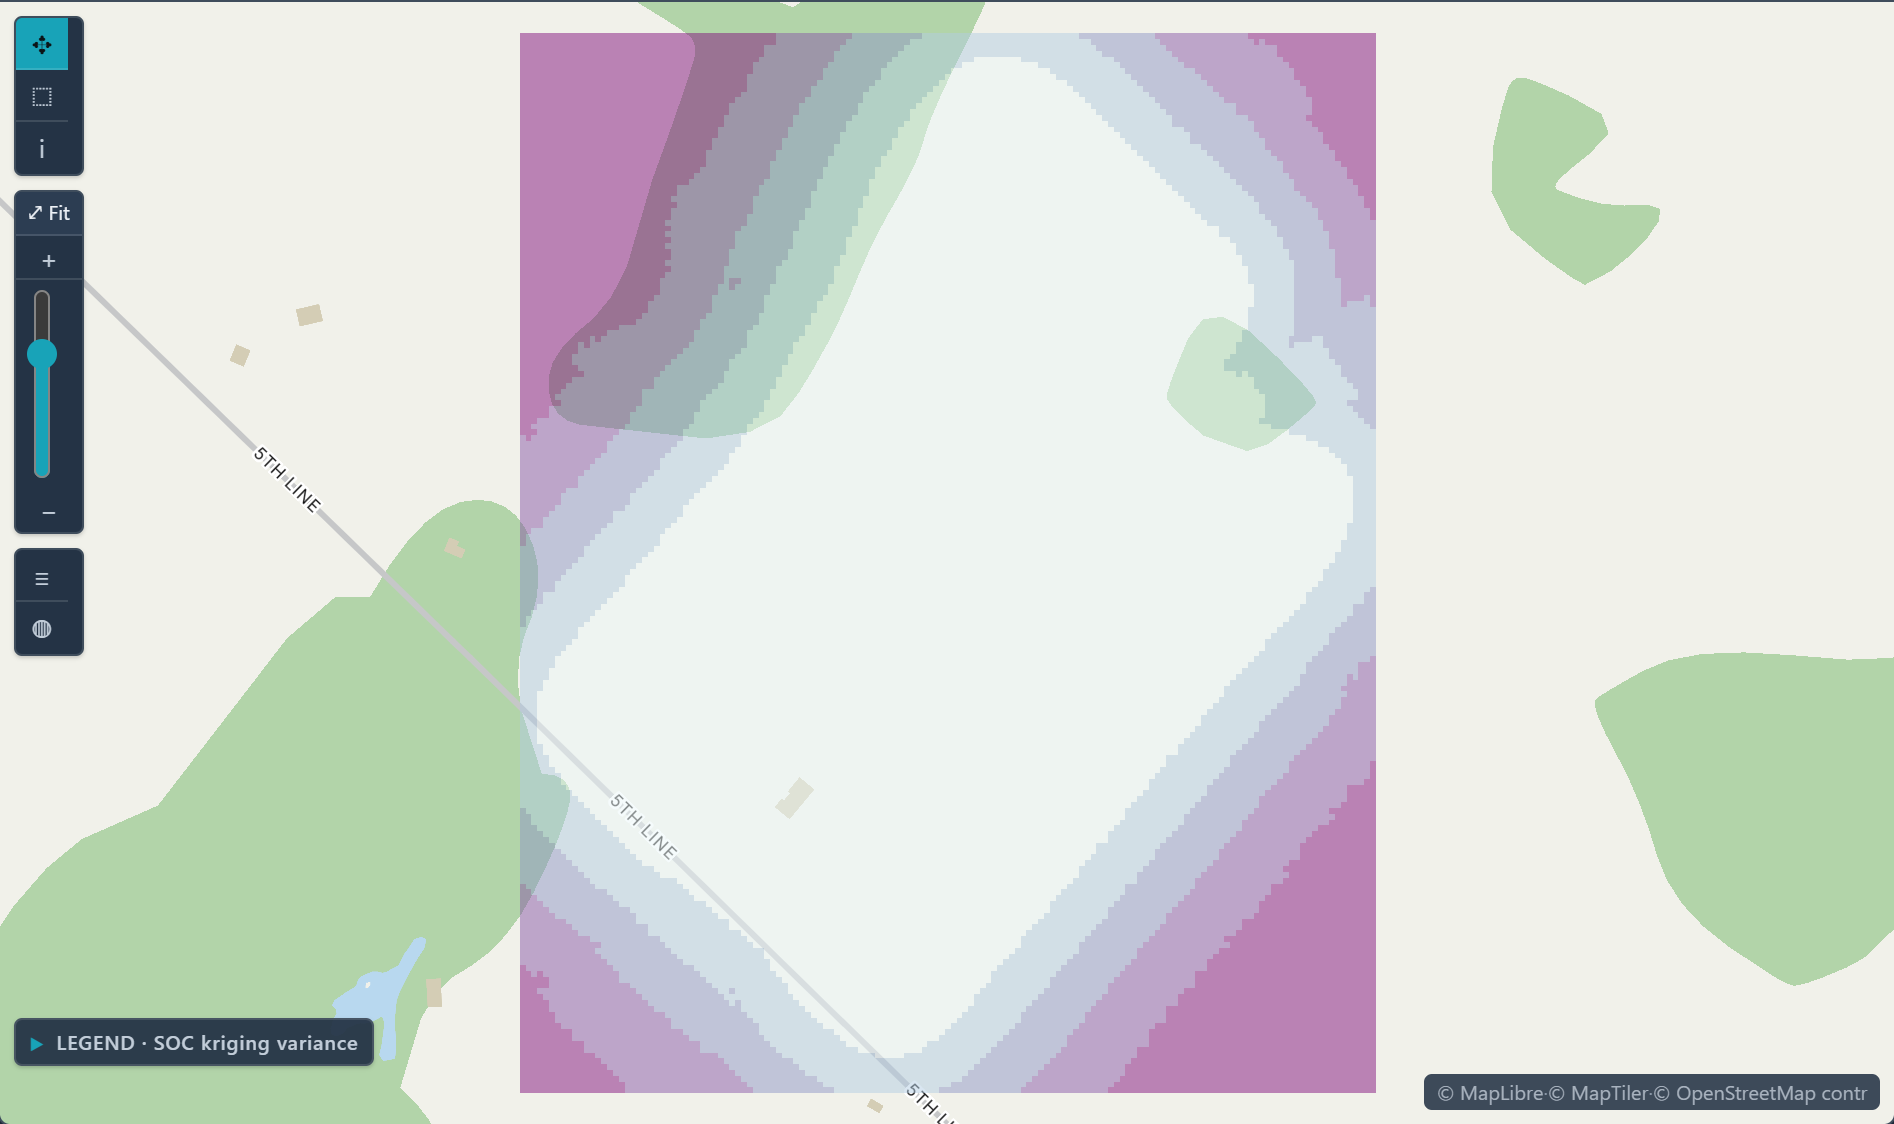
 Kriging variance · where the soil carbon estimate is less certain
The challenge
Budgets allow a limited number of new samples; placing them evenly wastes some of them.
Step 1Model what you haveFit a variogram to the current samples; its range shows the distance beyond which two samples are effectively independent.How to: Variography
Step 2Krige and map the varianceKrige the samples and read the kriging variance map, which shows where the estimate is weakest.How to: Kriging
Step 3Target the gapsPlace new samples in the high-variance areas, beyond the range of the nearest existing samples, where they add information the current ones do not.How to: Variography
Step 4Export for the field planExport the variance surface as GeoTIFF and the results as a report to take into the field plan.How to: Exporting data and pictures
Worked example · Soil organic carbon
Where should the next soil samples go to reduce uncertainty in soil organic carbon across this field?
- Fit the variogramNugget 0.52, plus Cubic structures of 0.49 at 419 m and 0.16 at 825 m, fitted to 840 samples of soil organic carbon.How to: Variography
- Krige SOCOrdinary kriging maps SOC across the field; the variance map is the surface to plan from.How to: Kriging
- Read the gapsVariance depends on where the samples are, not on their values, so it shows the thin parts of the design.How to: Kriging
What it found
The map shows variance lowest across the middle of the field and highest toward its edges; those edges are where more samples would help.
Variance shows where the design is thin, not how wrong an estimate is, and it does not use the measured values. Choosing the sites is still your call.
Soil organic carbon · kriged surface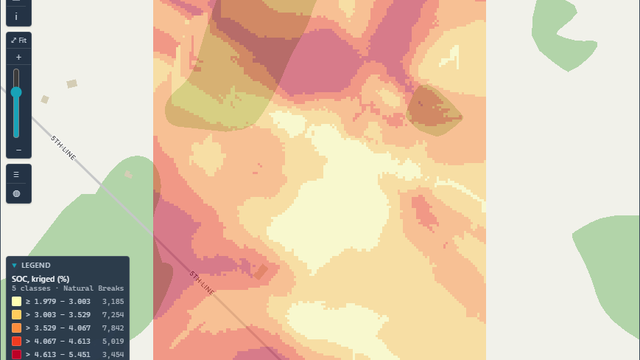
Open the sample projectRead-only · no sign-in
Read in the docs
Methods
Variogram modelingKriging varianceCross-validation
Data
Your sample data
Evidence
Published research by BioMedware scientistsGeostatistical modelling of uncertainty in soil scienceGoovaerts, P. Geoderma 103, 2001.
See every sample project