


Exposure & contamination mapping
Map exposure where you have no samples.
Interpolate contaminant levels from monitoring sites into a continuous surface, and map the probability of exceeding a regulatory threshold alongside every estimate.
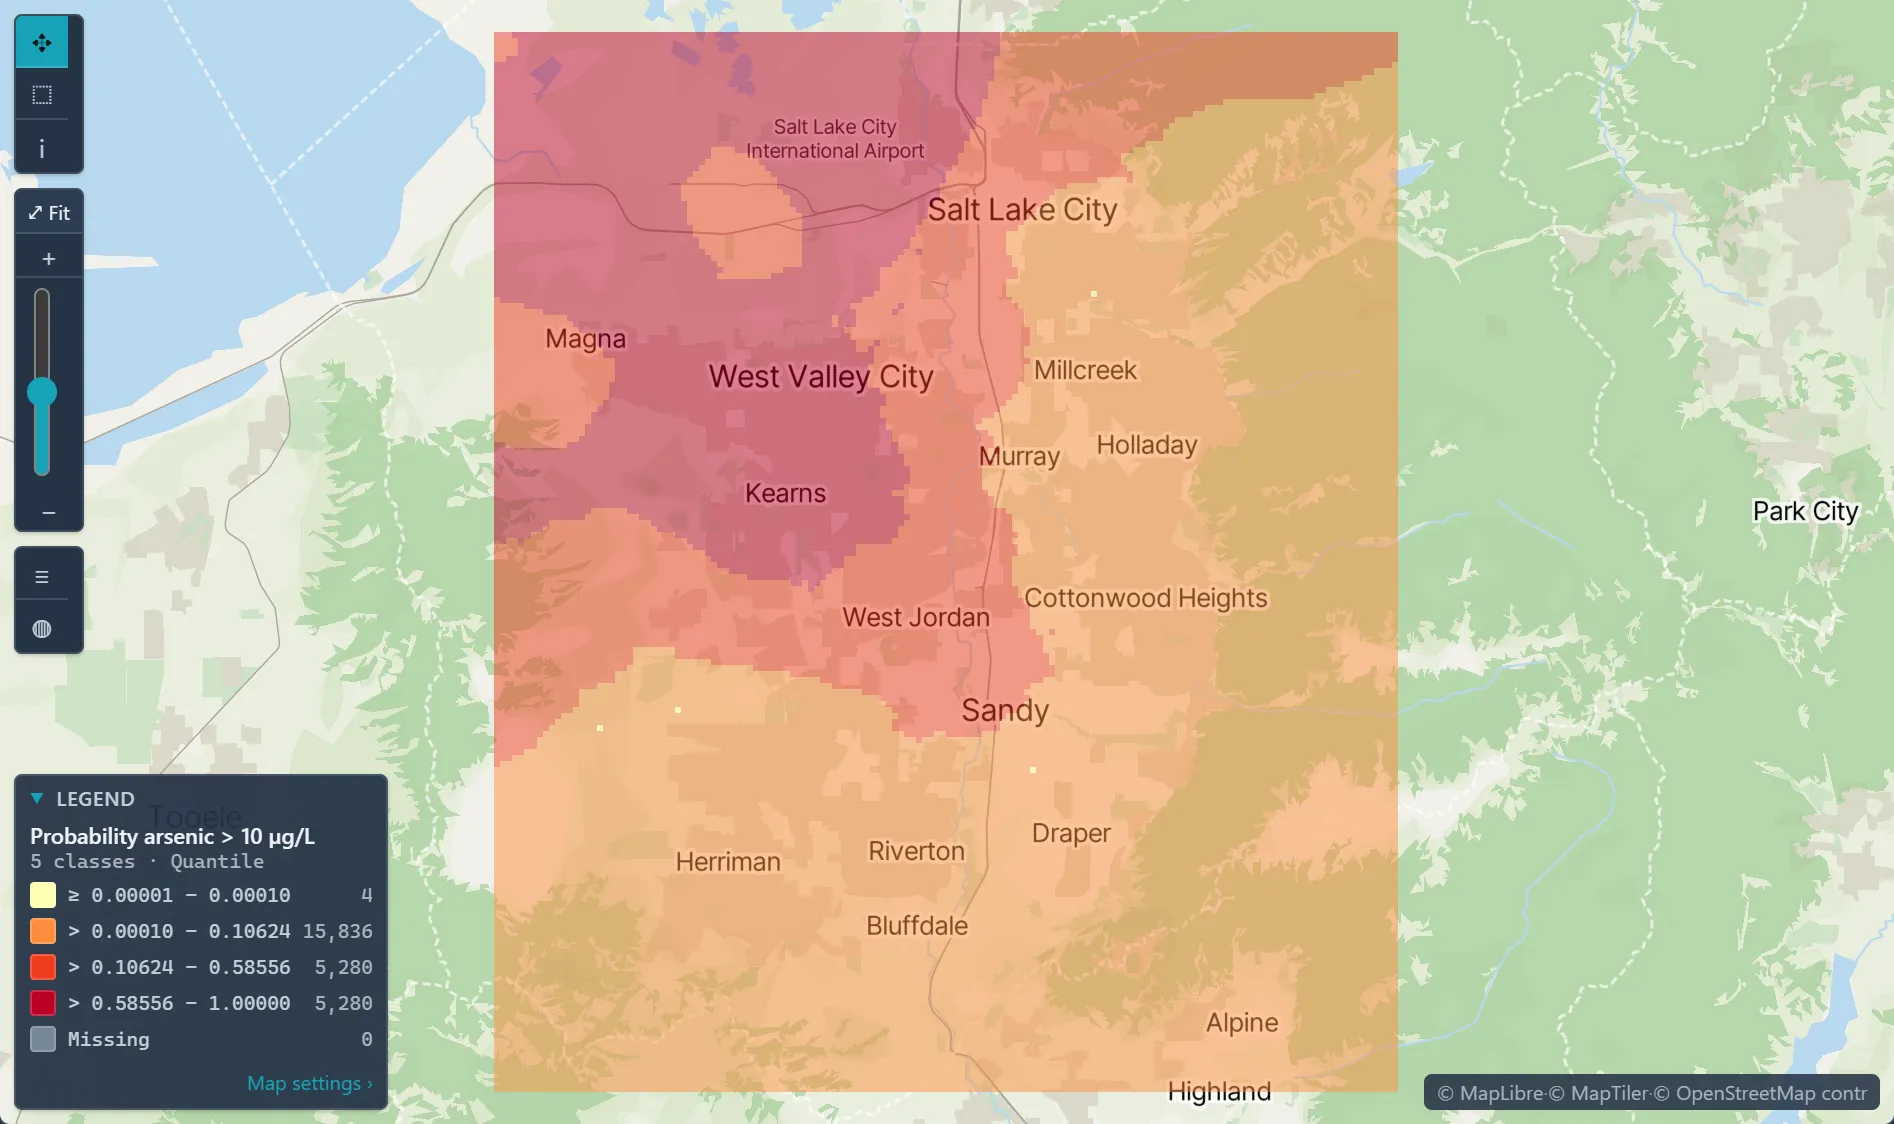
 Probability well water exceeds 10 µg/L arsenic · Salt Lake County
The challenge
Samples are sparse and unevenly spaced, and stakeholders want to know which homes, schools or fields are at risk.
Step 1Import the samplesUpload the monitoring results as one dataset: one row per well or site, its location and concentration, and a 0/1 column for above the limit, computed before import.How to: Importing data
Step 2Model the spatial structureFit a variogram to the concentrations; leave the family on Auto, which tries Spherical, Exponential and Cubic and keeps the best fit.How to: Variography
Step 3Map the probability of exceeding the limitIndicator kriging of the 0/1 column maps the probability of exceeding the limit between your sites, cell by cell.How to: Kriging
Step 4Check and deliverCheck the cross-validation, then export the probability surface as GeoTIFF and the results as a report, and share it read-only with reviewers; those without a Vesta account get a read-only link.How to: Exporting data and pictures
Worked example · Well-water arsenic
At the places between wells, how likely is arsenic above the 10 µg/L limit in Salt Lake County?
- Start from the wells186 wells with per-well medians since 1991; non-detects set at half the reporting limit, and co-located wells merged.How to: Importing data
- Mark the limitA 0/1 column marks each well above 10 µg/L, the WHO guideline and U.S. EPA limit; 29.6% of the wells are above it.
- Krige the indicatorIndicator kriging onto a raster grid estimates the probability that arsenic exceeds 10 µg/L at every cell.How to: Kriging
- Check it against held-back wellsLeave-one-out validation reached 83.3% accuracy against a 70.4% baseline, in the sample's build run.How to: Kriging
What it found
The map shows the probability highest around West Valley City and Kearns and lower toward the east and south. Cells far from any well carry the least support.
The 83.3% comes from the script that built the sample, so run Validation in Kriging on your own data to check it. A probability is an estimate from 186 wells, not a lab result.
Well-water arsenic · probability above 10 µg/L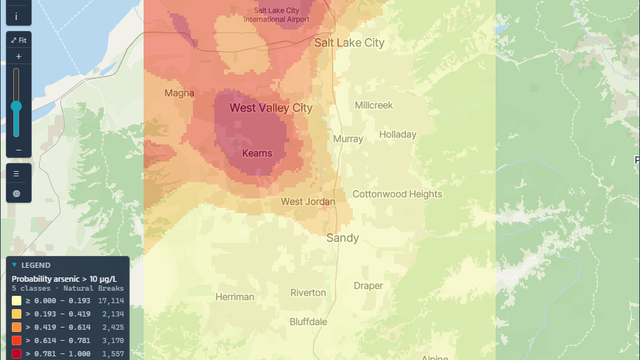
Open the sample projectRead-only · no sign-in
Read in the docs
Methods
KrigingIndicator krigingCross-validationCompositional (logratio) variograms
Data
Your monitoring dataCDC EPH TrackingACS demographics
Evidence
Customer storyMonitoring lead levels in Flint, MichiganThe analysis identified the housing units with the highest probability of having service lines made of hazardous materials, giving replacement programs a ranked list to work from.
Published research by BioMedware scientistsGeostatistical prediction of water lead levels in Flint, Michigan: A multivariate approachGoovaerts, P. Science of the Total Environment 647, 2019.
See every sample project