


Site & resource assessment
Estimate what's in the ground, and how sure you are.
Model grade, soil properties or contamination across a site from your drill-hole or core samples, with co-kriging for a correlated variable and logratio variograms for compositional data.
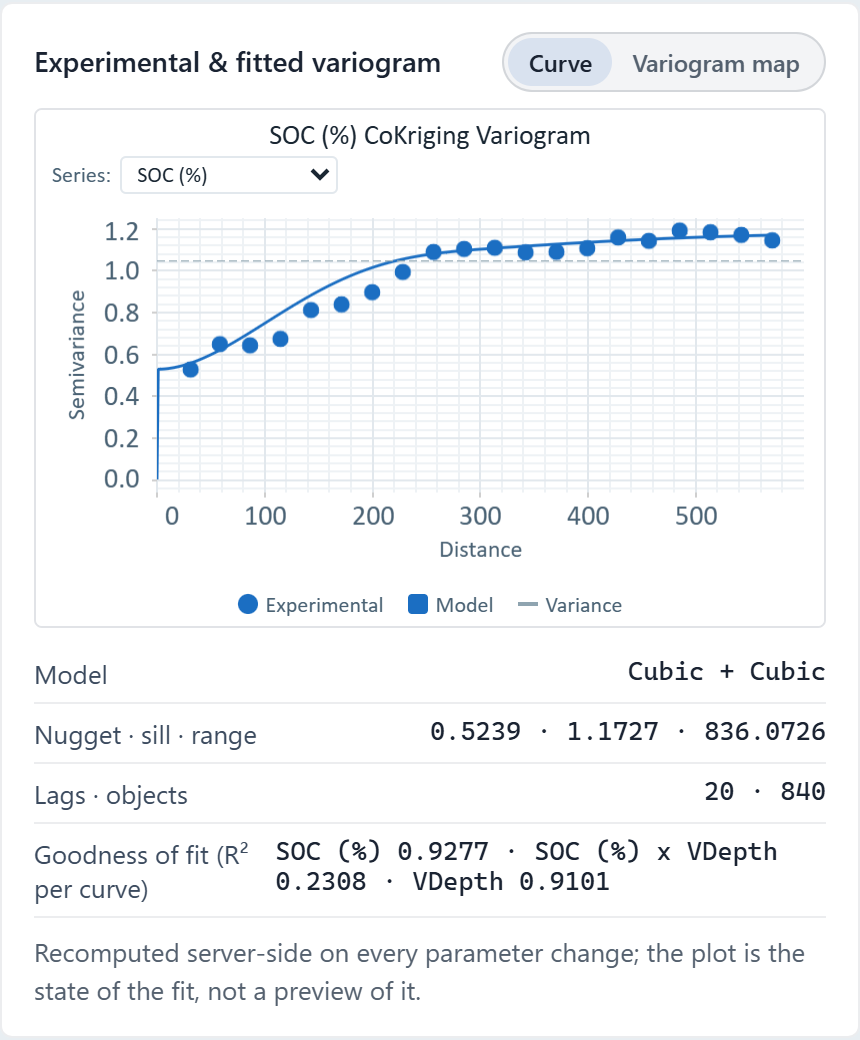
 Cokriging variogram · soil organic carbon, one Ontario field
The challenge
Drilling is expensive, decisions are large, and estimates must hold up to review.
Step 1Load the samplesImport assay or core samples with coordinates, one row per sample, and each measured variable as a column.How to: Importing data
Step 2Model the spatial structureFit a variogram for each variable; for a correlated one, add it as a covariate at Full control guidance so Vesta fits a cross-variogram.How to: Co-kriging
Step 3Estimate and checkKrige the variable, read the variance map for weak spots, and cross-validate with leave-one-out before you rely on the surface.How to: Kriging
Step 4DeliverExport the estimate surface as GeoTIFF and the results as a report, and share the project read-only with reviewers; those without a Vesta account get a read-only link.How to: Exporting data and pictures
Worked example · Soil organic carbon
How much of the variation in soil organic carbon across one field is spatially structured, and over what distance?
- Start from the samples840 soil samples of organic carbon (SOC, %) from one 26-hectare field in southern Ontario.How to: Importing data
- Fit the structureThe fitted variogram has a nugget of 0.52 and two Cubic structures, with ranges of 419 m and 825 m.How to: Variography
- Krige and cross-validateOrdinary kriging across the field; the build script's leave-one-out run gave an RMSE of 0.637 and a correlation of 0.783.How to: Kriging
What it found
Carbon is spatially correlated out to about 419 m, with a second structure to 825 m and a nugget of 0.52 for variation finer than the sampling or measurement error. The kriged surface and its variance map give the estimate and where it is weak.
Ranges are in Web Mercator units, about 1.38 times the ground distance at this latitude, so the 825 m range is about 596 m on the ground. Over one field the kriged values are unaffected.
Kriged soil organic carbon · one Ontario field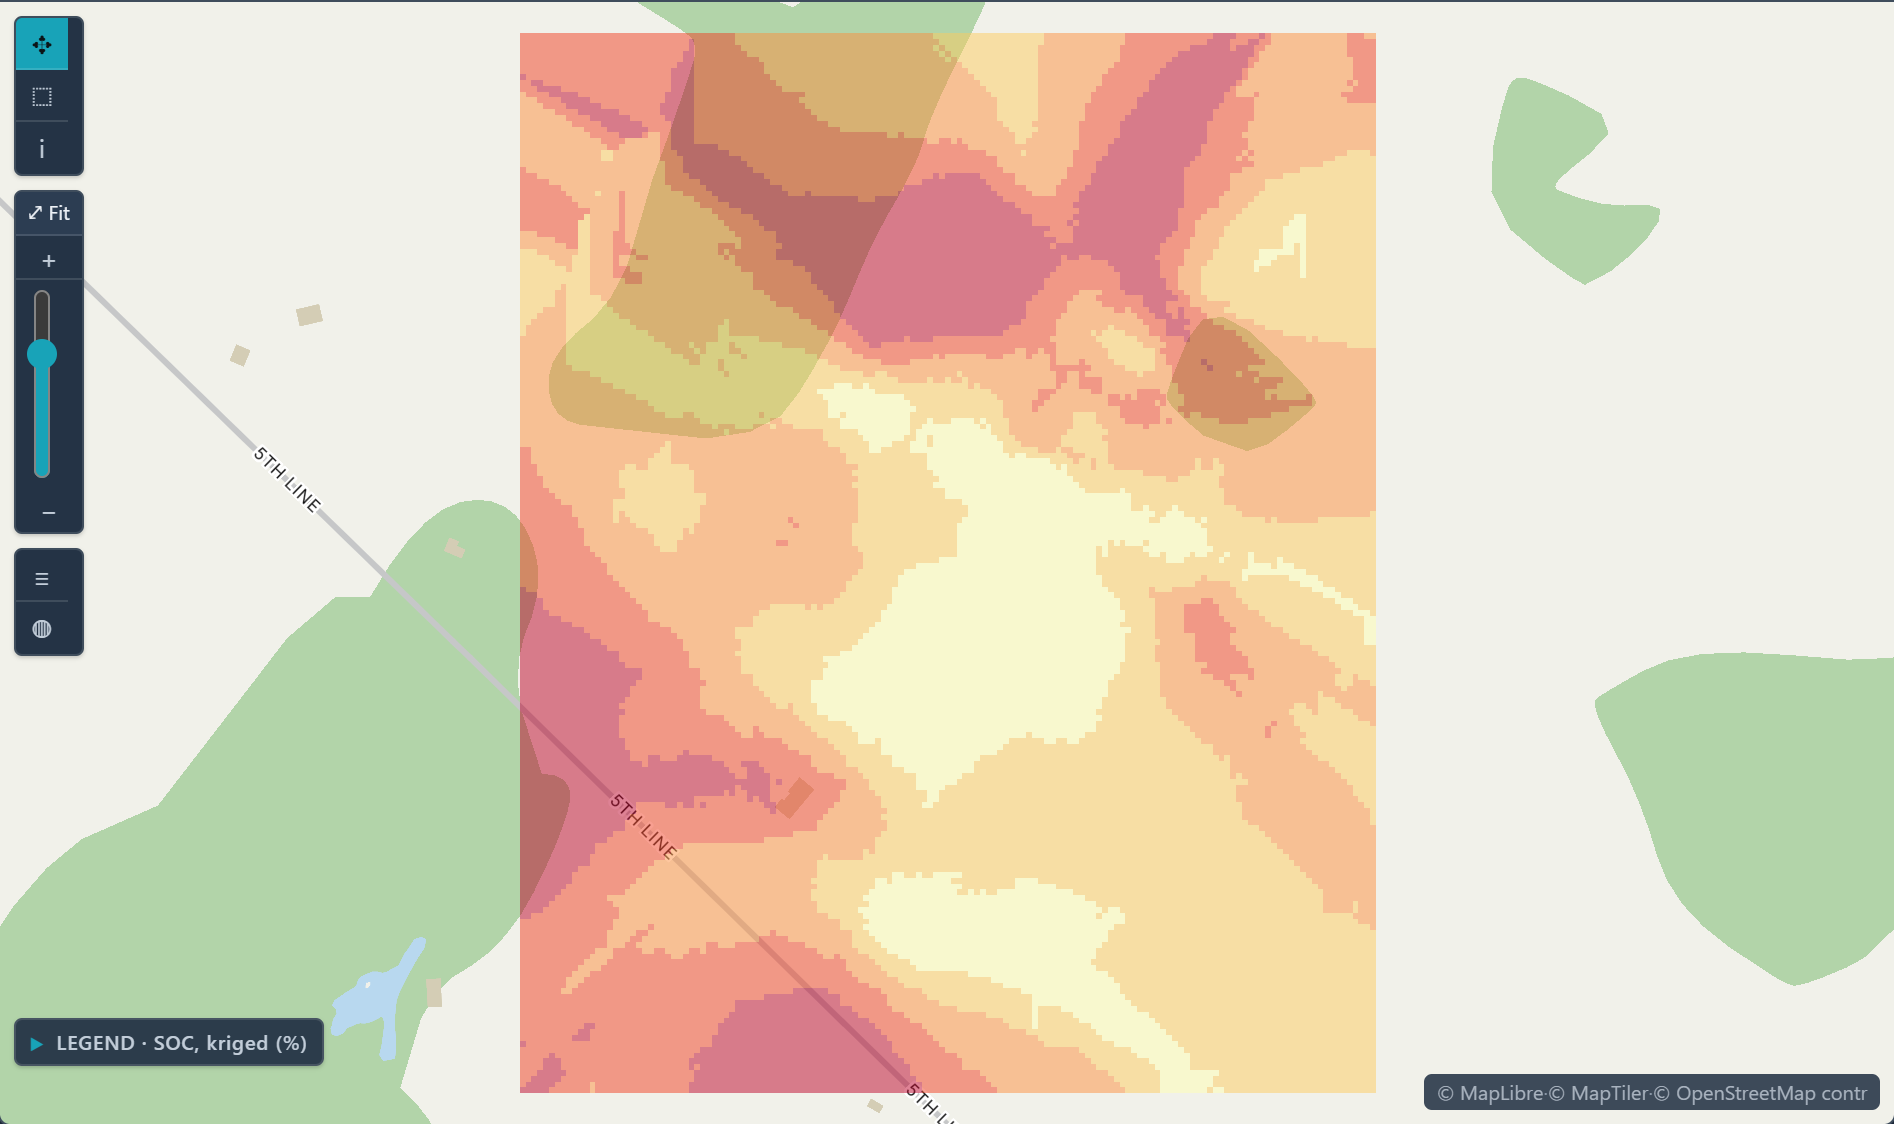
Open the sample projectRead-only · no sign-in
Read in the docs
Methods
KrigingCo-krigingCompositional (logratio) variogramsIndicator krigingCross-validation
Data
Your sample dataGeographic boundaries
Evidence
Published research by BioMedware scientistsFrom natural resources evaluation to spatial epidemiology: 25 years in the makingGoovaerts, P. Mathematical Geosciences 53, 2021.
See every sample project