


Environmental consulting
Deliver the site report sooner.
Go from field samples to exceedance maps and uncertainty in one project, and share it read-only with the client team; anyone without a Vesta account gets a read-only link.
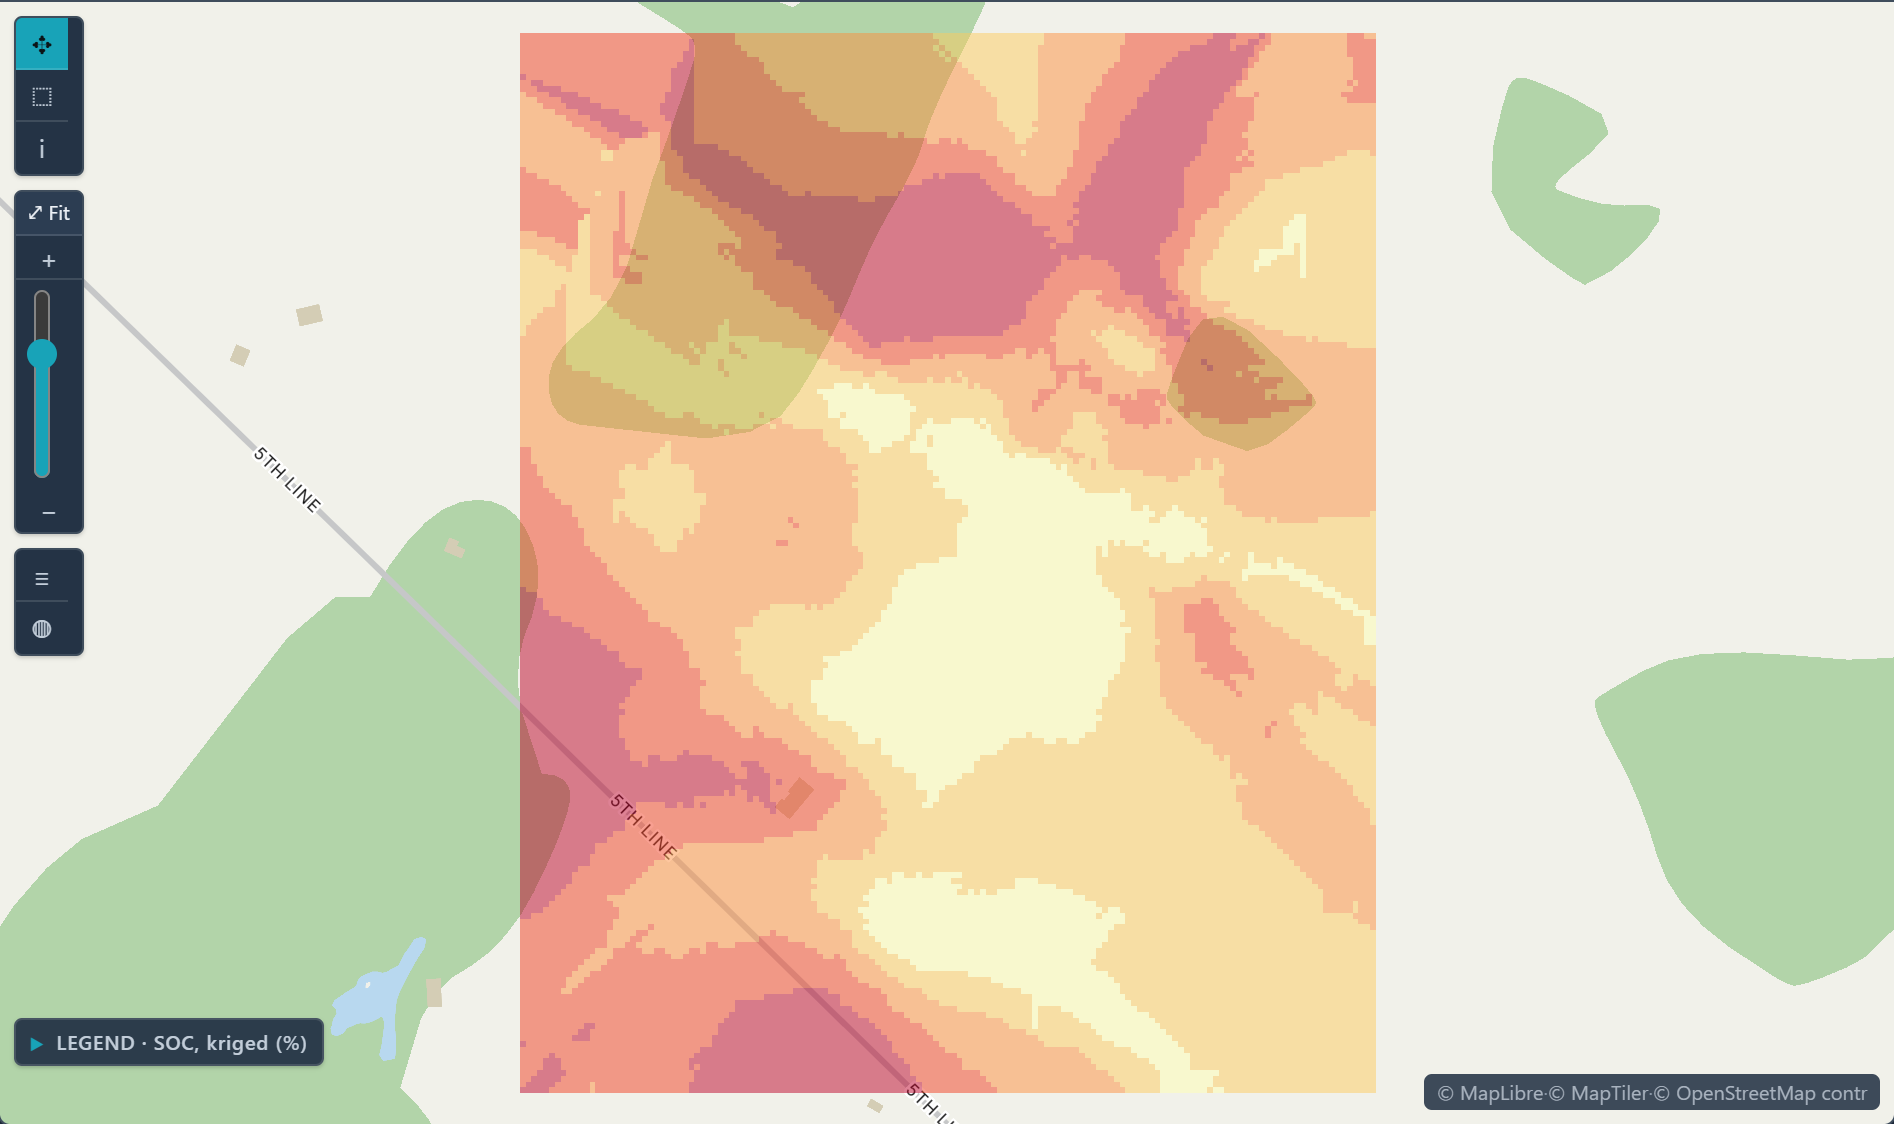
 Kriged soil organic carbon · one Ontario field
The challenge
Every project has a deadline, a regulator and a client who wants a clear map.
Step 1Bring in the field dataUpload sample locations and lab results as one dataset in a new project.How to: Importing data
Step 2Map where the limit is exceededIndicator kriging maps the probability of exceeding a threshold, such as a regulatory limit.How to: Kriging
Step 3Check the estimate before you send itLeave-one-out cross-validation compares each prediction with the value measured there, and the variance map shows where more samples would help.How to: Kriging
Step 4Deliver to the clientExport results as GeoTIFF and as a report, and share the project with view-only access by email; reviewers without a Vesta account get a read-only link.How to: Exporting data and pictures
Worked example · Well-water arsenic
Where in Salt Lake County is well water likely to exceed the 10 µg/L arsenic limit?
- Start from the wells186 wells with per-well medians since 1991, non-detects at half the reporting limit and co-located wells merged. 29.6% are above 10 µg/L.How to: Importing data
- Use a 0/1 variable for the limitThe project carries "Arsenic above 10 µg/L", which marks each well above or below the WHO guideline and U.S. EPA limit.
- Krige the indicatorIndicator kriging onto a raster grid estimates the probability that arsenic exceeds 10 µg/L at every cell.How to: Kriging
- Check it against held-back wellsWhen the sample was built, leave-one-out validation classified 83.3% of wells correctly, against a 70.4% baseline.How to: Kriging
What it found
The map shows the probability highest around West Valley City and Kearns and lower toward the east and south.
The validation figures come from the script that built the sample; its web summary does not show them, so run Validation in Kriging on your own data. A probability is an estimate from 186 wells, not a measurement at an unsampled well, and a map does not replace a lab result.
Probability well water exceeds 10 µg/L arsenic · Salt Lake County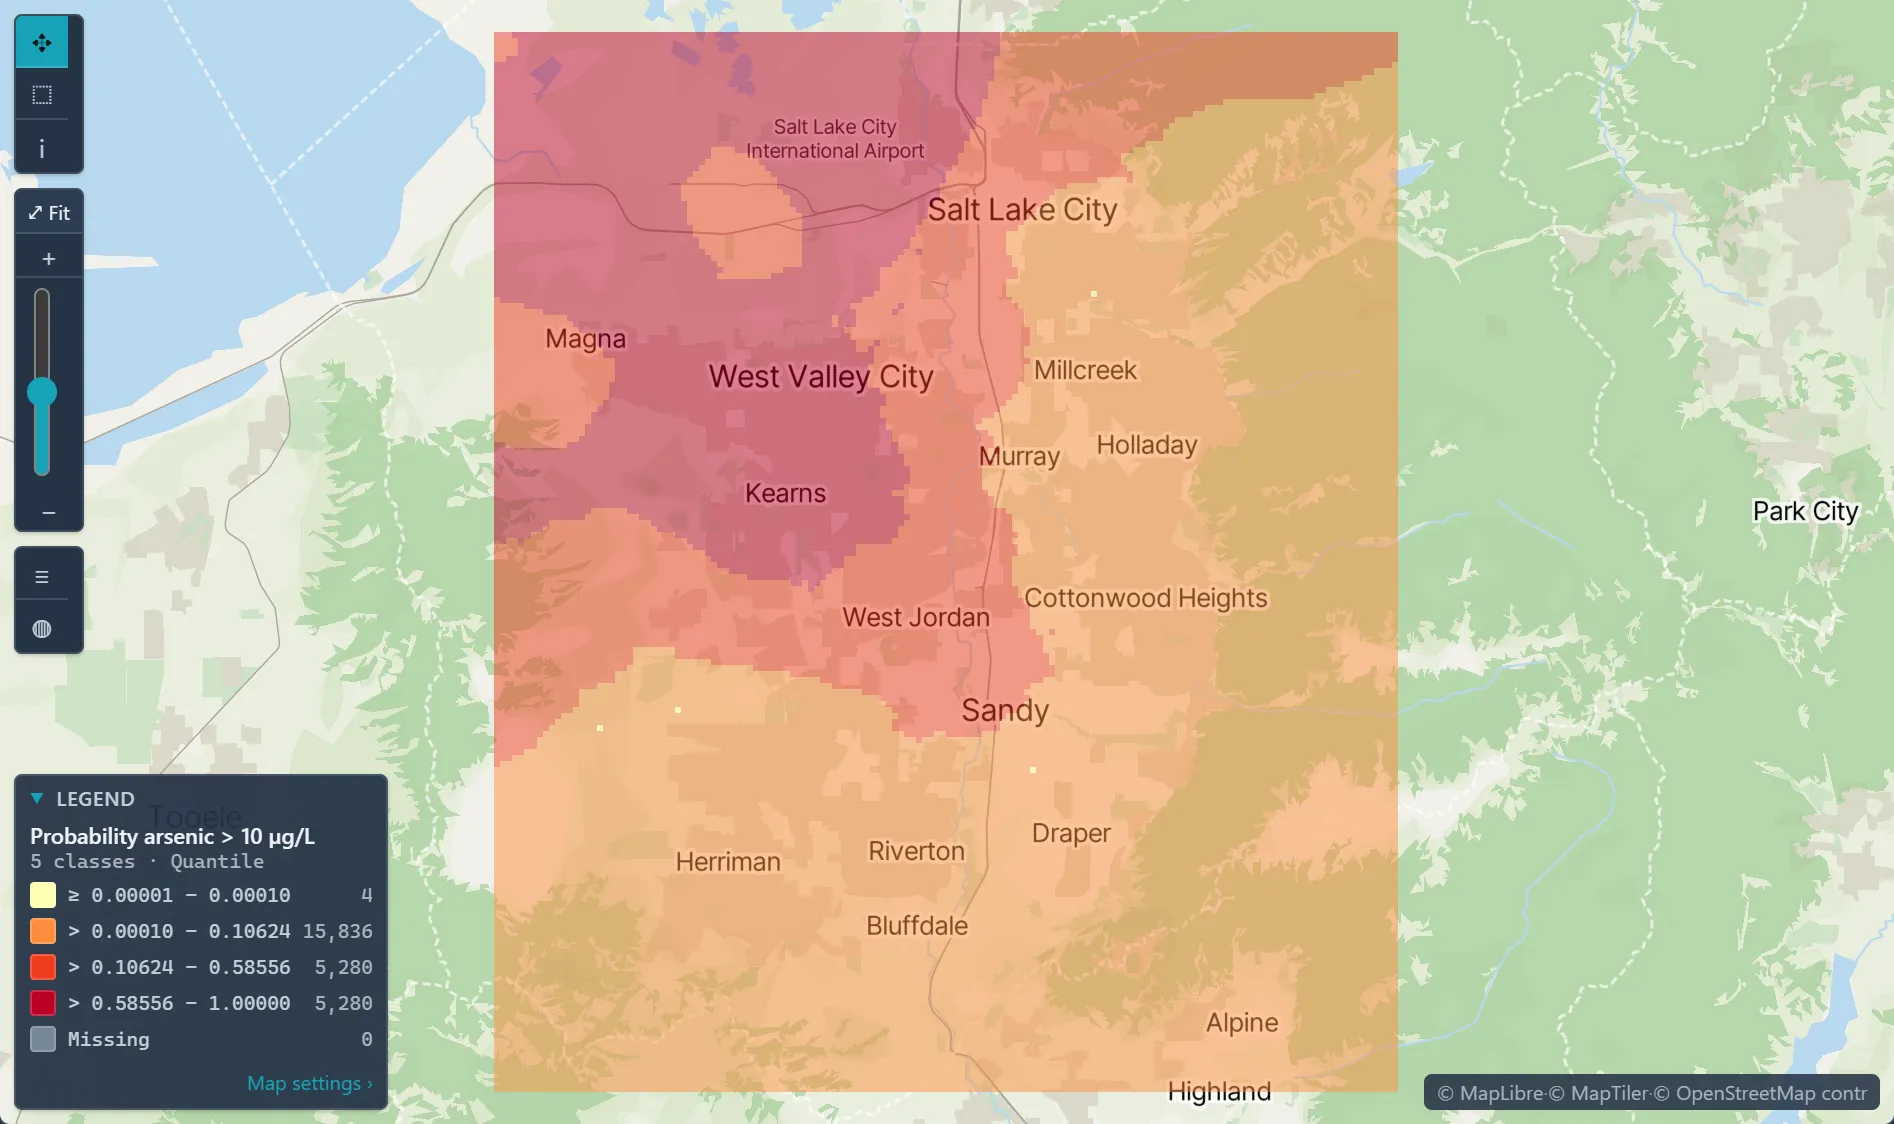
Open the sample projectRead-only · no sign-in
Read in the docs
Methods
Indicator krigingKrigingCross-validation
Data
Your field dataGeographic boundaries
Evidence
Customer storyMonitoring lead levels in Flint, MichiganThe analysis identified the housing units with the highest probability of having service lines made of hazardous materials, giving replacement programs a ranked list to work from.
Published research by BioMedware scientistsGeostatistical modeling of the spatial variability of arsenic in groundwater of southeast MichiganGoovaerts, P., AvRuskin, G., Meliker, J., et al. Water Resources Research 41, 2005.
See every sample project