


 Data Library
25+ public data sources, a click away.
Pick a source, choose the measures, the places and the years. Vesta fetches the data and joins it to boundaries, ready to map, with no downloading, cleaning or merging.
HealthCDC BRFSS, Chronic Disease Indicators, PLACES, Drug Poisoning Mortality, YRBSS and Environmental Public Health Tracking.
DemographicsUS Census ACS, Decennial, Population Estimates and the International Database; World Bank, WorldPop and HDX HAPI.
Animal health and agricultureWAHIS and EMPRES-i outbreak events, FAOSTAT, Gridded Livestock of the World and livestock production systems.
Environment and geographyMODIS land-surface temperature and vegetation, WorldClim climate, OpenTopography elevation, GRIP roads and boundaries at every level.
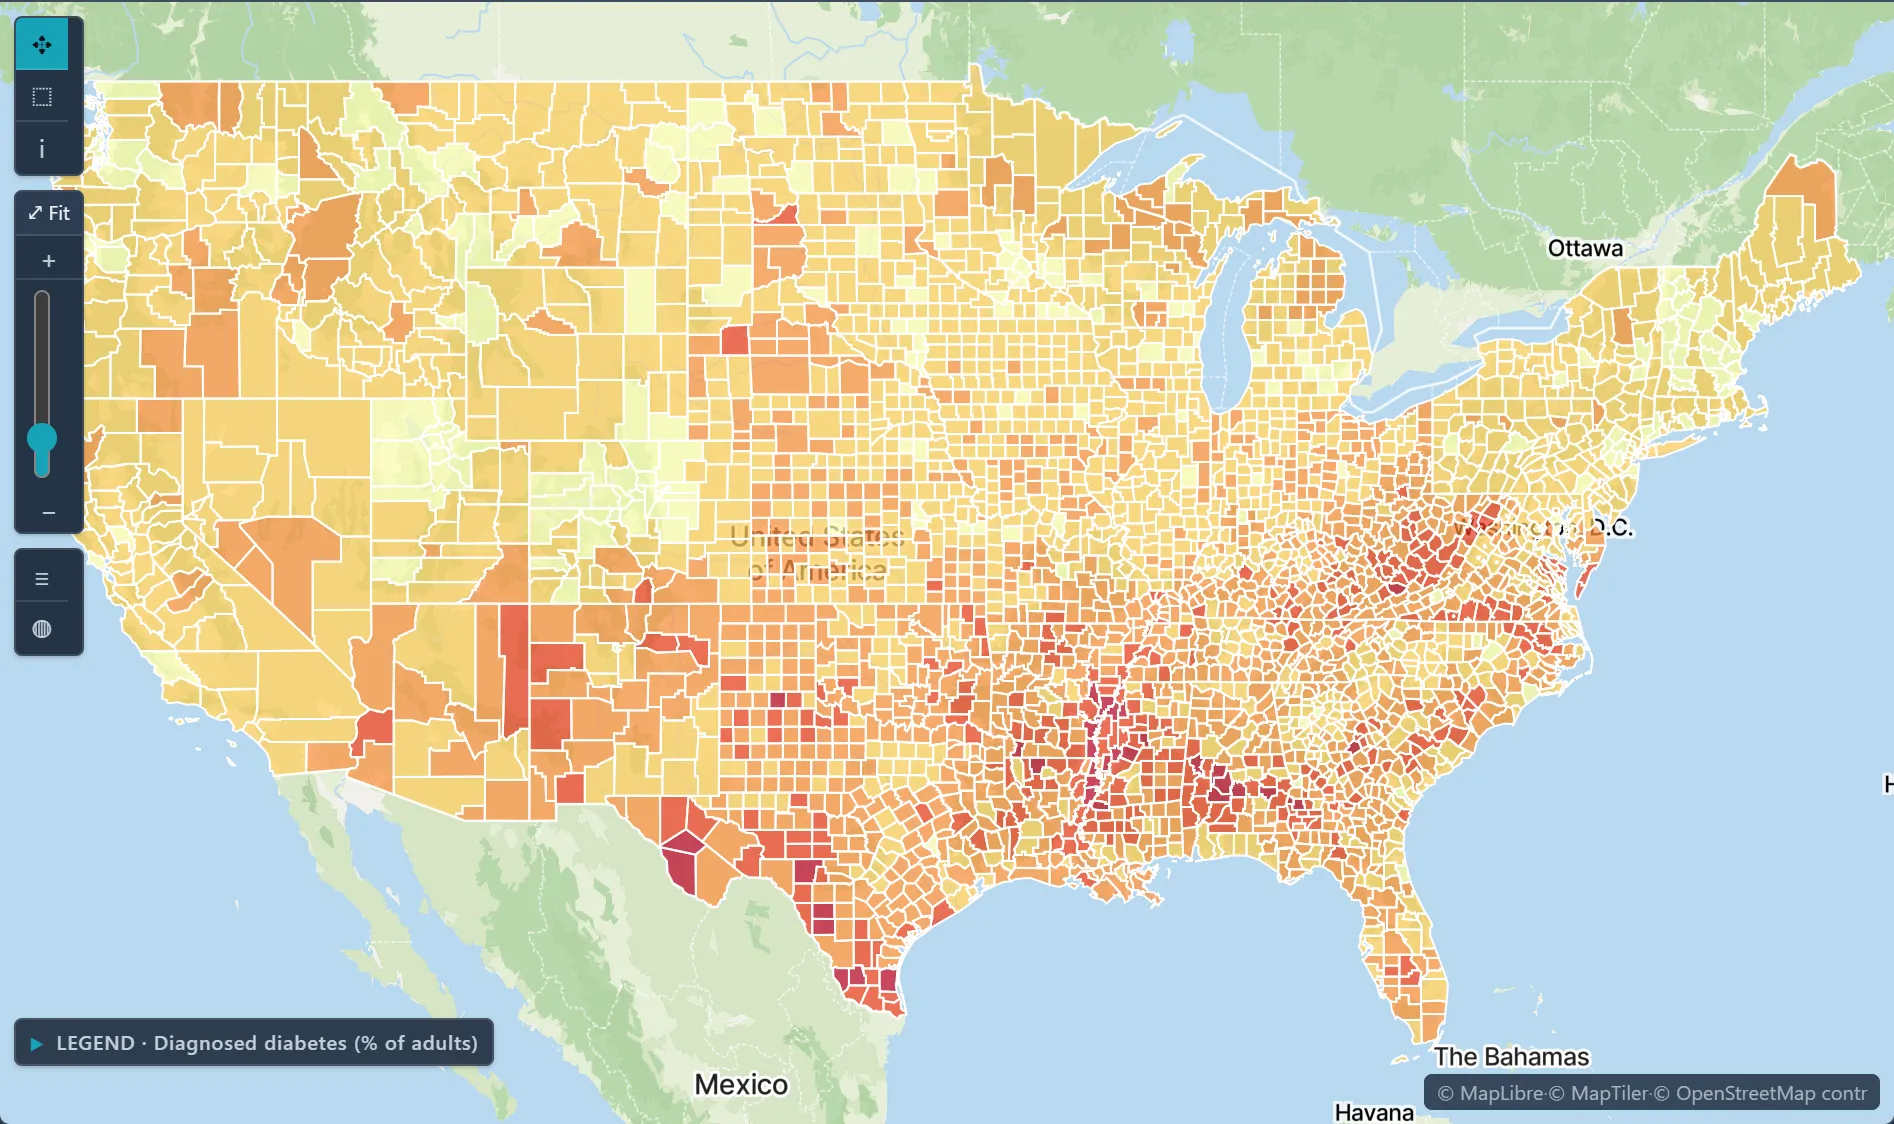
 Diagnosed diabetes, adults (%) · U.S. counties, 2022
✦ Try asking the Advisor"Find county-level obesity prevalence and median household income for the Midwest, most recent year."Runs on sample data in the trial workspace.
What's included
CDC PLACES · BRFSS · CDI · YRBSSCDC Drug Poisoning MortalityCDC EPH TrackingUS Census ACS · Decennial · PEP · IDBWorld Bank · WorldPop · HDX HAPIWAHIS · EMPRES-iFAOSTAT · GLW · GLPSMODIS LST & NDVIWorldClim · OpenTopography · GRIPGeographic boundaries
Health disparities & accessLink diabetes and other county outcomes to poverty and other measures from the Data Library, then map where the link is strongest and where high rates cluster.Disease surveillance over timeCombine joinpoint regression, space-time kriging and the workspace time slider to see where rates rose, when the trend changed, and how the pattern moved.Risk factor modelingFit a regression of an outcome on its drivers, then check where the model fits well and where it does not. Logistic regression takes a 0/1 outcome, and GWR shows how each effect changes across the map.