


Method guides
Plain-language explanations of each method: what question it answers, what the output means, and the mistakes to avoid. Each guide ends with a sample project to try it on.
 Fitted variogram of soil organic carbon · one Ontario field
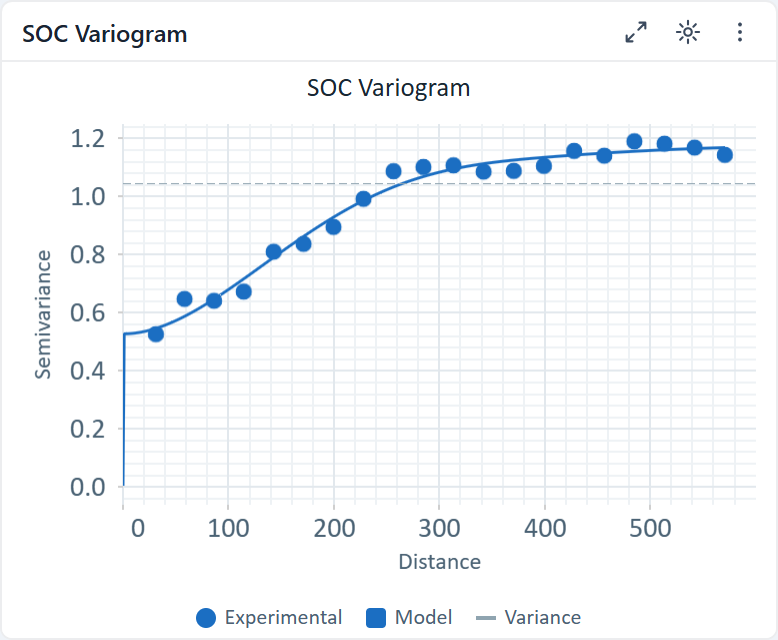
Geostatistics · 8 minSpatial interpolation (kriging), explained for epidemiologistsVariograms, weights and uncertainty without the matrix algebra.
- Nearby things are more alike
- From weights to a surface
- Report the uncertainty too
The Advisor proposes the CDC PLACES diabetes import · U.S. counties, 2020–2024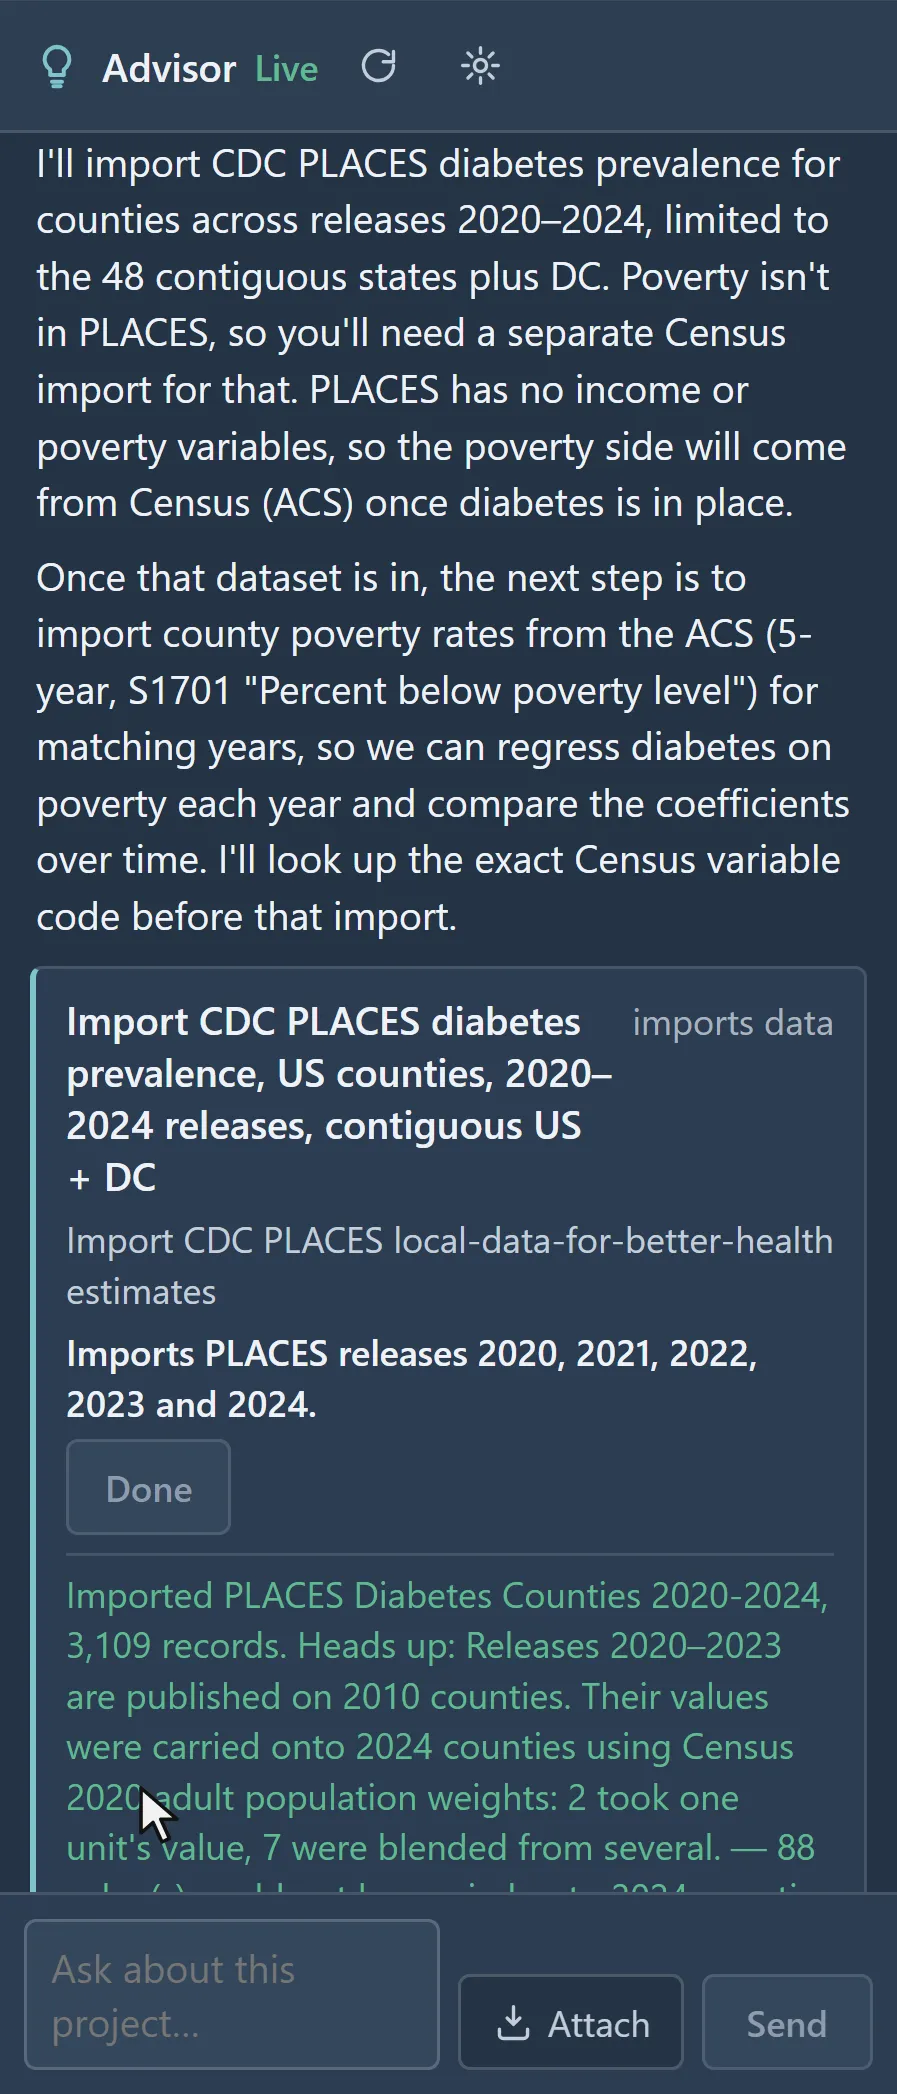
Start hereChoosing a methodA decision guide from your question and data type to the right analysis.
- Points or areas?
- Describe, explain or predict?
- When time matters
Local Moran's I clusters · diabetes among U.S. adults, by county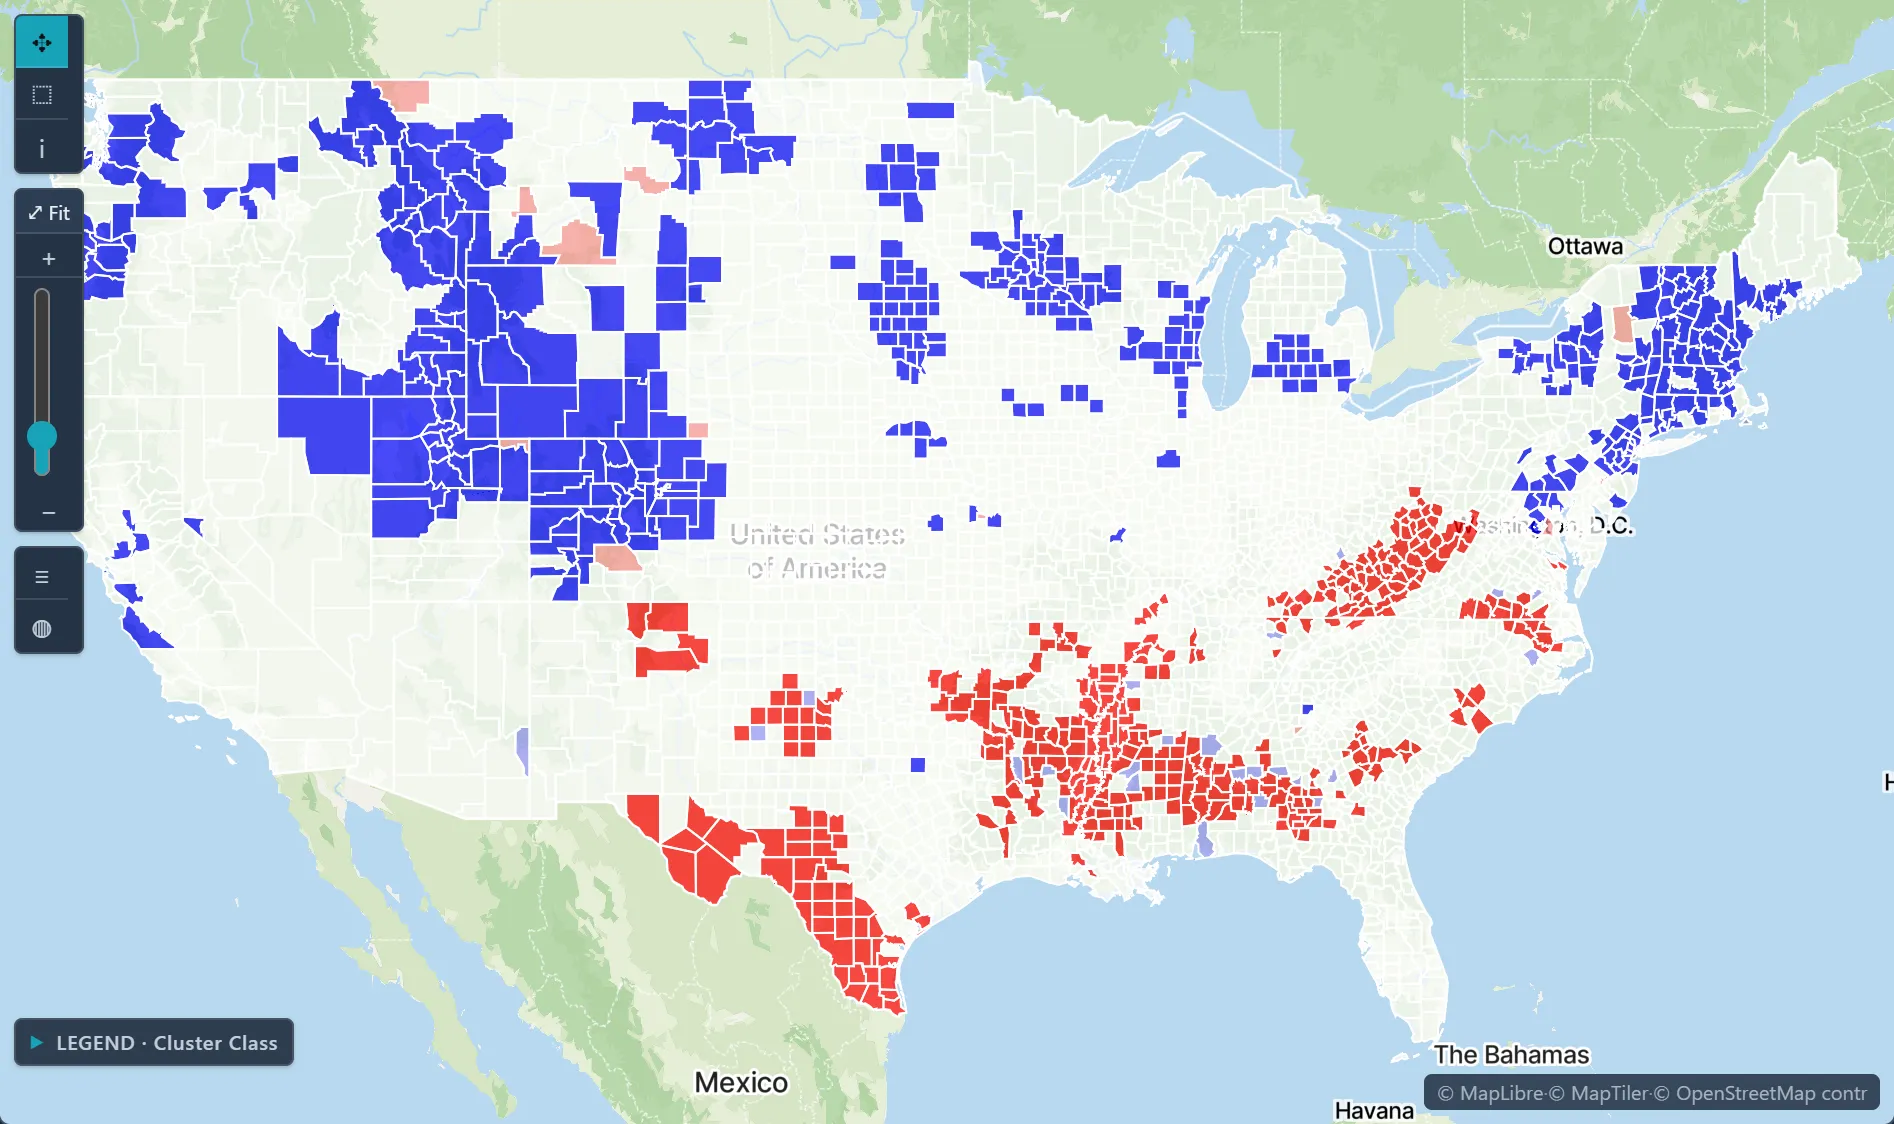
ClustersLocal Moran's I vs scan statisticsWhich cluster method answers which question.
- Local autocorrelation
- Circular and space-time scans
- Reading Monte Carlo p-values
Local GWR slope · diabetes per point of poverty, U.S. counties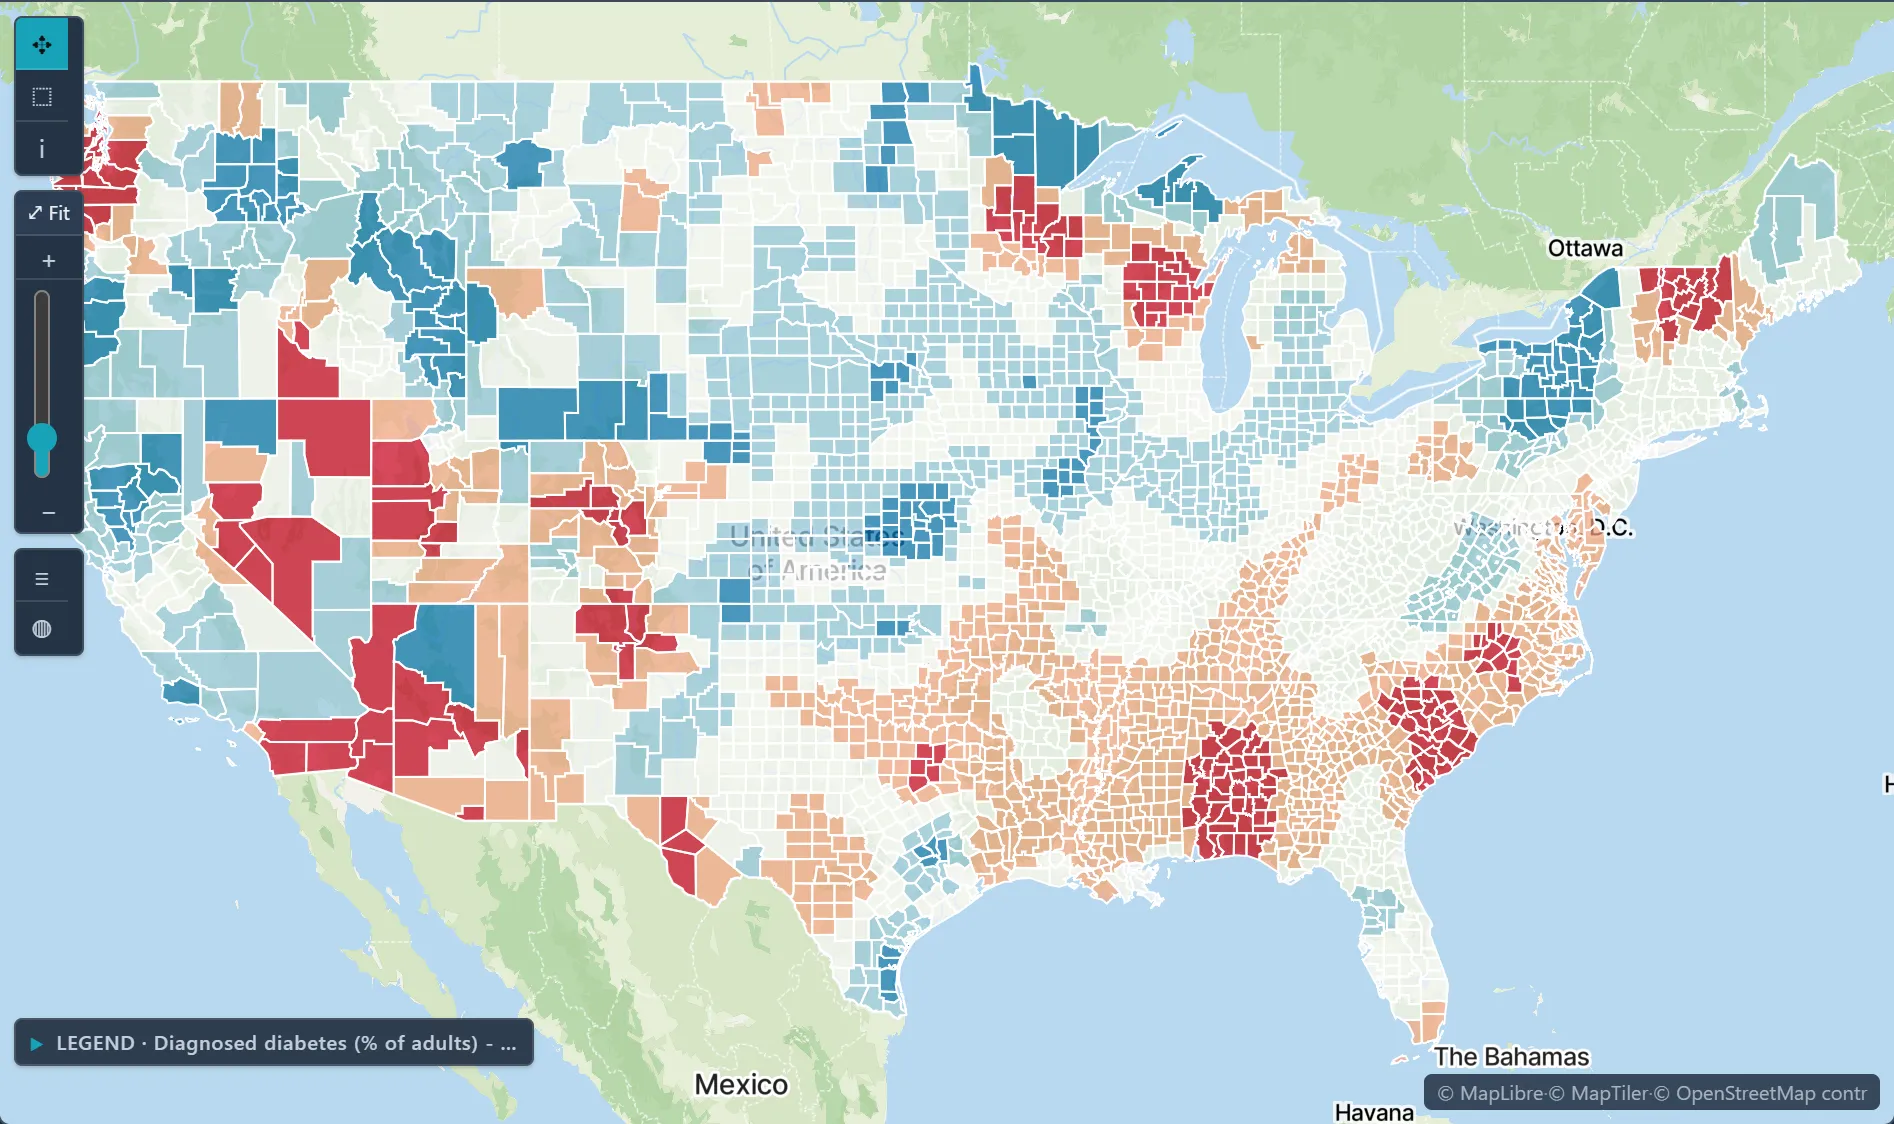
RegressionGeographically weighted regression in practiceBandwidth, local R² and how to read coefficient maps.
- Global vs local models
- Choosing a bandwidth
- Mapping local coefficients
County overdose death rates with the statewide joinpoint trend (2014) · Ohio, 2003–2021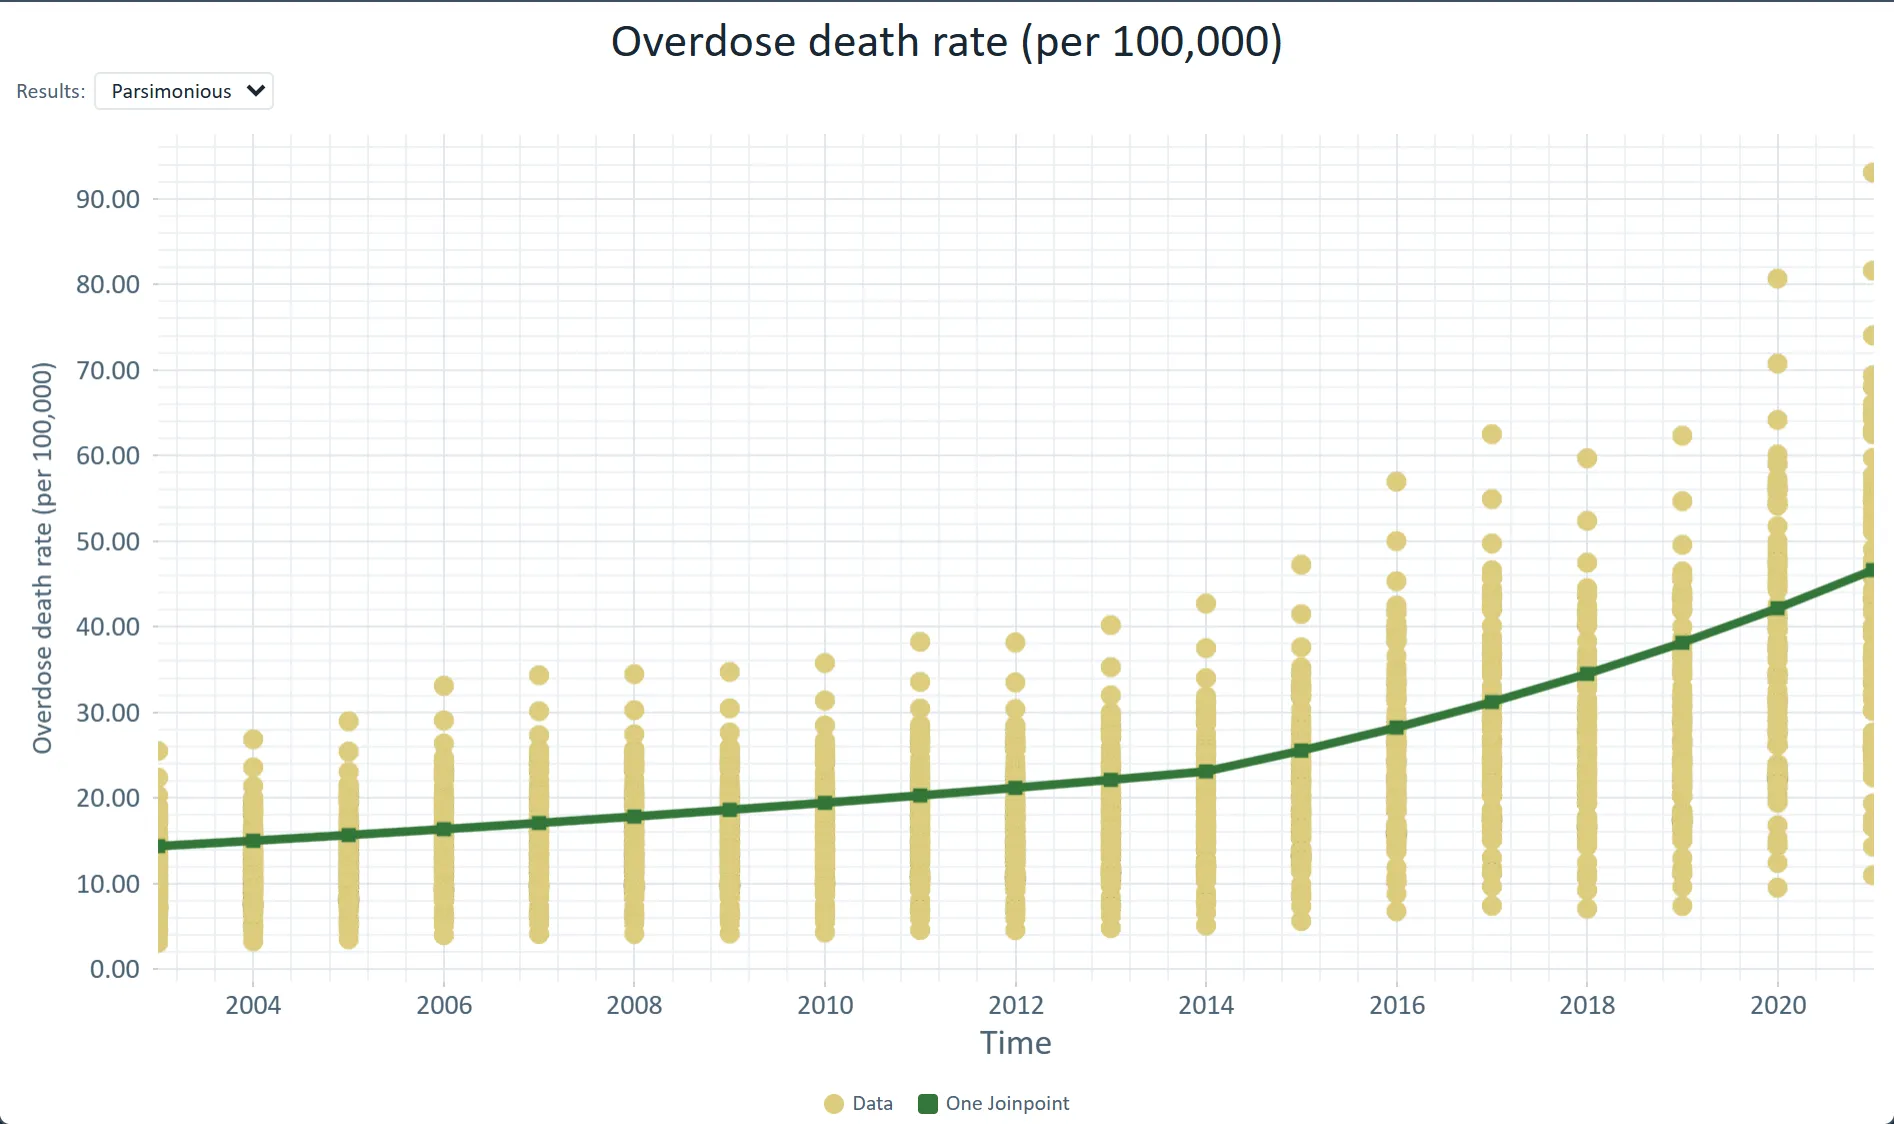
TrendsJoinpoint regression for surveillanceFinding the year a trend changed, and reporting APC.
- Segments and joinpoints
- Annual percent change
- Comparing places
Diagnosed diabetes, adults (%) · U.S. counties, 2022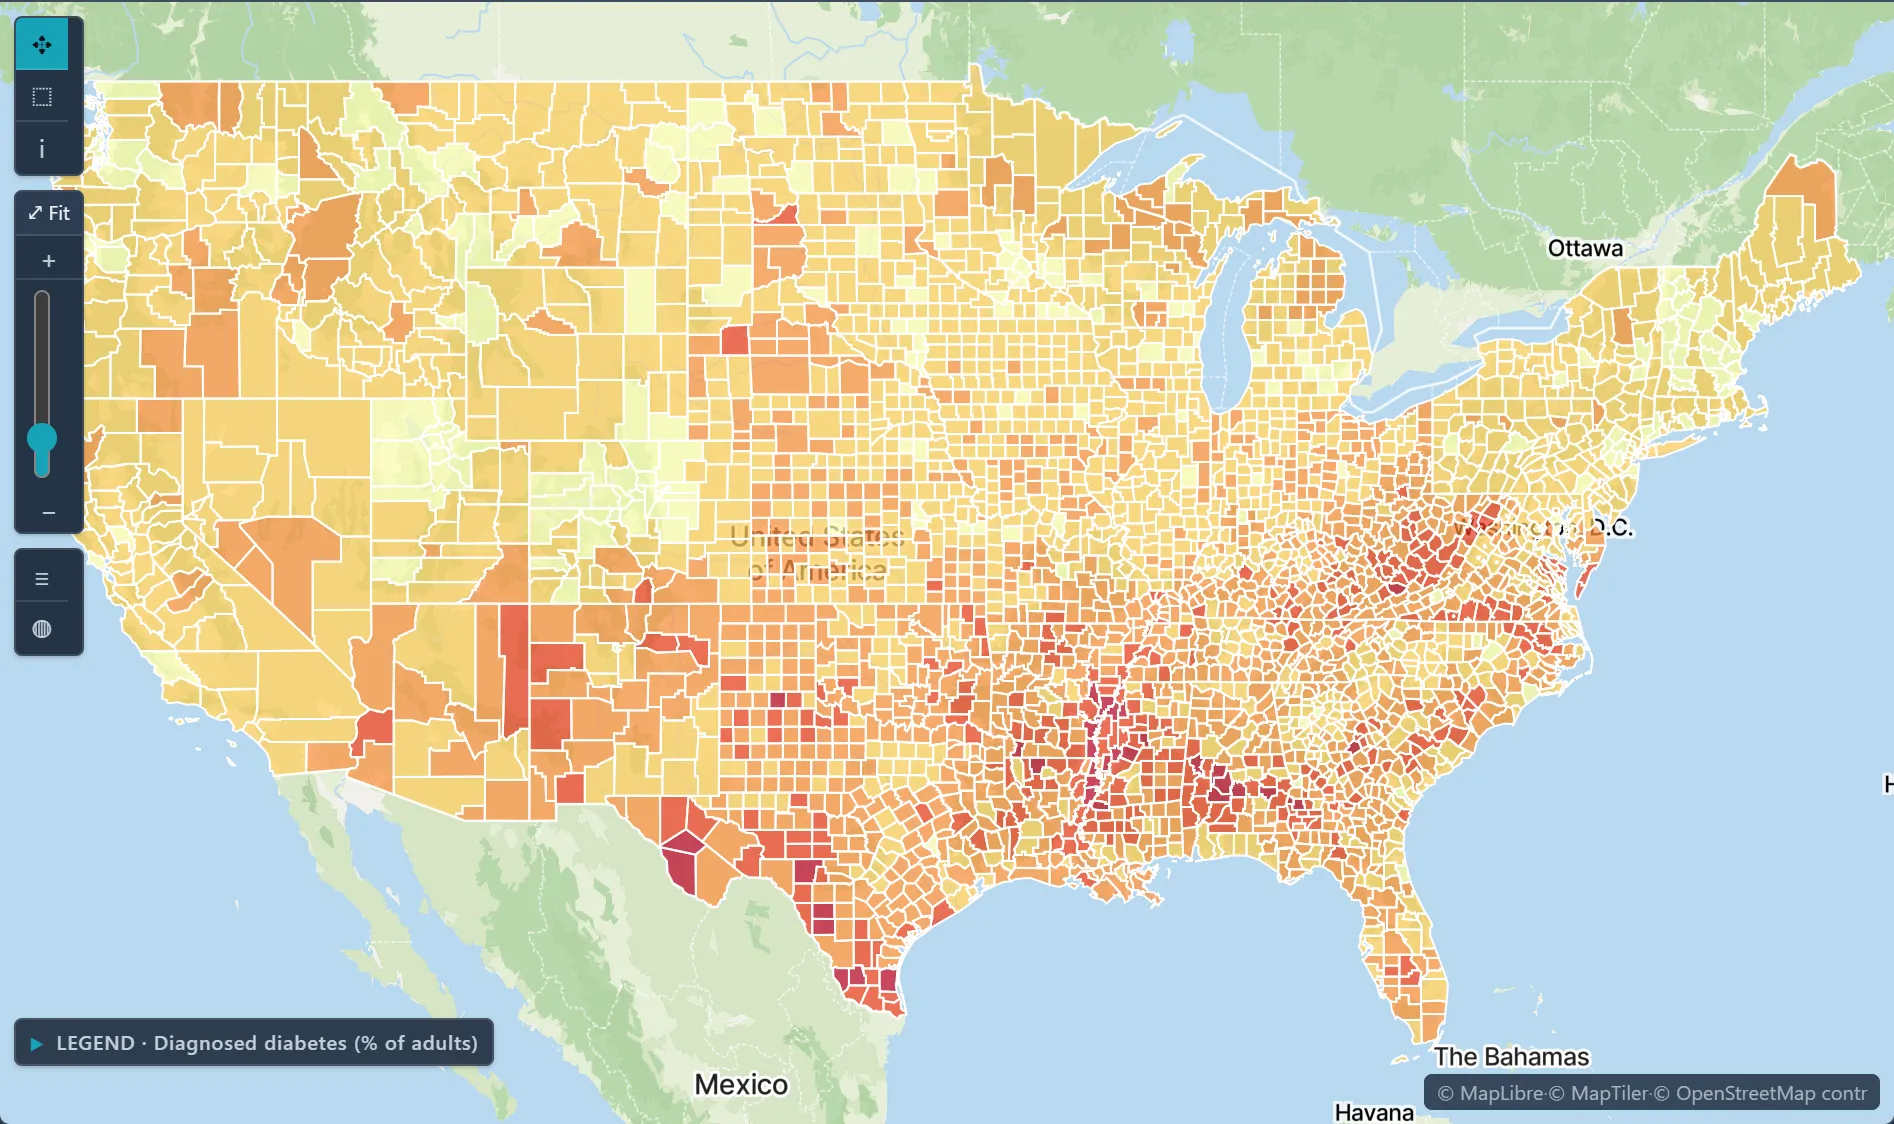
DataRates from small numbersWhy rates in small populations are unstable, and how the import wizard spots them and offers to smooth them.
- Why small counts mislead
- When the import wizard suggests smoothing
- Empirical Bayes smoothing