


Outbreak & cluster detection
Find the cluster before it spreads.
Find where and when cases cluster with a space-time scan, and judge each cluster's significance by Monte Carlo replications.
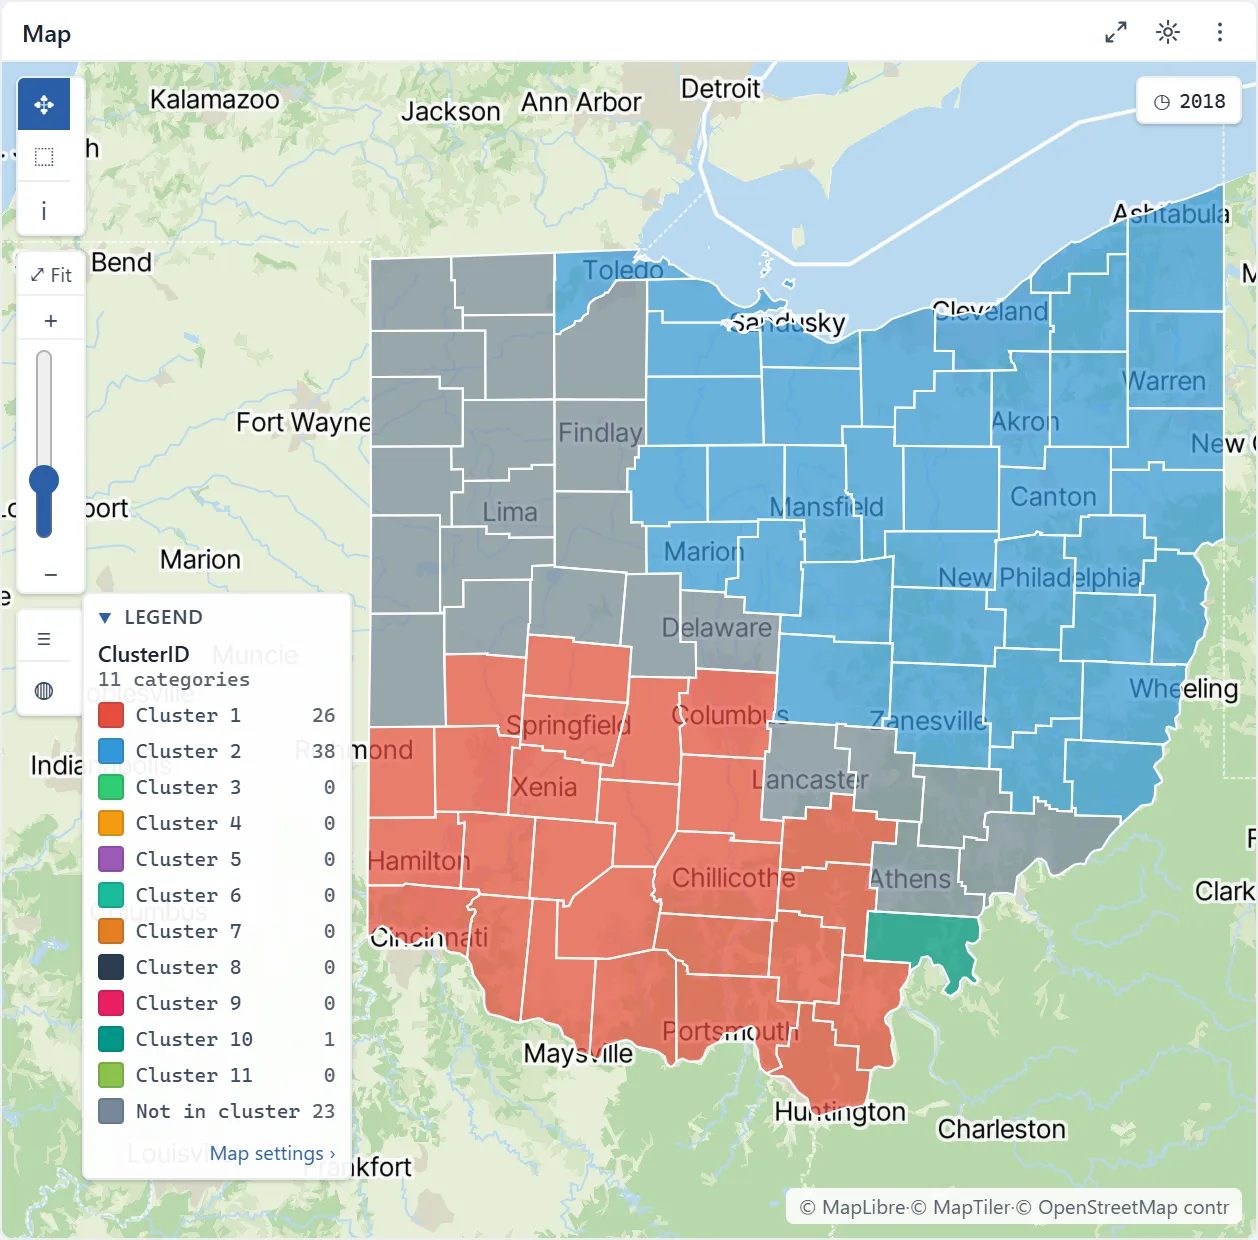
 Space-time scan clusters of estimated overdose deaths · Ohio counties, 2018
The challenge
Case counts rise in a few places, and you need to tell real clusters from chance before you deploy staff or issue an alert.
Step 1Bring in the case reportsUpload the outbreak reports as one dataset, with coordinates or area codes for each report.How to: Importing data
Step 2Put the population on the same gridChange of scale moves a population layer onto the same grid or areas as the cases, so each place carries both numbers.How to: Preparing data
Step 3Scan for clusters in space and timeRun a space-time scan of cases against population, capping each cluster at a share of the population and of the study period.How to: Scan statistics
Step 4Deliver the clustersExport the results and a report for the incident team and partner agencies.How to: Exporting data and pictures
Worked example · Avian influenza in Europe
Where and when did avian influenza in poultry hit harder than the chicken population would predict?
- Start from the outbreaksThe sample holds 3,443 outbreak reports from October 2021 to September 2023; 3,375 fall on a 50 km grid of 1,664 cells.How to: Data Library
- Set the populationChicken counts from the FAO's GLW4 for 2020 were aggregated onto the same grid, to serve as each cell's population.How to: Preparing data
- Run the scanSpace-time scan, Poisson, high rates: at most 10% of the population and 20% of the study period in one cluster, 999 replications, seed 42.How to: Scan statistics
What it found
The scan reports 11 clusters, all at p = 0.001. The most likely is 1,319 outbreaks in western France from February to June 2022, against 30.4 expected (relative risk 43.4). A smaller one, 170 outbreaks in east-central Europe in April and May 2022, has a relative risk of 205.
A scan finds where and when outbreaks cluster, not why, and its result depends on the maximum sizes: rerun at a smaller maximum before calling a cluster local or short-lived.
Avian influenza in Europe · space-time clusters, April 2022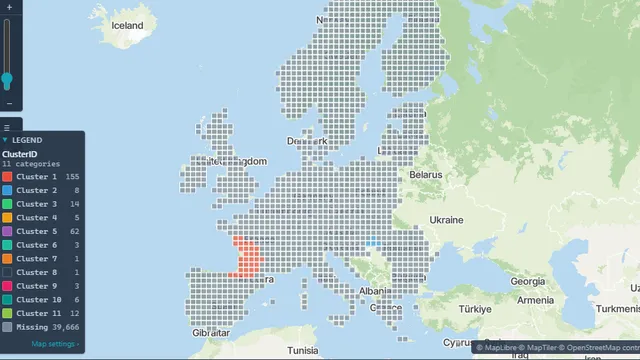
Open the sample projectRead-only · no sign-in
Read in the docs
Methods
Local Moran's ISpatial scanSpace-time scanMonte Carlo p-values
Data
Your surveillance dataACS populationGeographic boundaries
Evidence
Published research by BioMedware scientistsEvaluation of the risk of neighbourhood infection of H7N1 highly pathogenic avian influenza in Italy using Q statisticMulatti, P., Kitron, U., Jacquez, G.M., et al. Preventive Veterinary Medicine 95, 2010.
See every sample project